How saddle pressure mats work, what they show about load, symmetry and movement, what they cannot measure, and a repeatable before-and-after protocol.
Saddle pressure mapping uses a thin sensor mat laid over the saddle to show where, and how hard, a rider loads it while pedalling. It shows the spread of pressure, the centre of pressure, left-right symmetry and how much the pelvis moves. That turns "it feels wrong" into a picture the rider and the fitter can both see. It cannot measure comfort itself, friction, or what happens inside soft tissue, so it is most useful as one tool beside the conversation, the fitter's eye and motion capture.
How does saddle pressure mapping work?
Saddle pressure mapping lays a flexible sheet with a grid of small sensors over the saddle. Each sensor measures the force pressing straight into it, which software divides by the sensor's area to give pressure. The system reads every sensor many times a second and draws the result as a colour map, usually averaged over many pedal strokes.
Novel, a measurement maker whose systems range from shoe insoles to horse saddles, describes its sensors as calibrated capacitive sensors that measure pressure distribution or normal contact force.
Fitting studios use systems built for the bike. The German company gebioMized, based in Münster, offers dynamic pressure measurement at the rider's contact points: the saddle, the feet, and the arm pads and handlebar. Its software shows a colour map or a three-dimensional pressure landscape and flags asymmetries and phases of loading and unloading. Pressure is shown in units such as kilopascals or millibar (1 kPa is 10 mbar).
How trustworthy are the numbers? Bressel and Cronin tested a saddle mat in 2005. The sum of its readings matched known weights placed on the saddle closely (a correlation of 0.97), and readings within one session were very consistent. Between two separate sessions, though, agreement ranged from excellent to almost none, depending on the measure. The practical lesson: compare positions within one session where you can, and treat comparisons across days with care.
What does a saddle pressure map show?
A saddle pressure map shows where on the saddle the rider sits and how hard each area is loaded. It also shows how evenly the two sides share the load and how much the pelvis moves with each pedal stroke.
Most systems report a similar set of measures. This is what each one means and what a fitter looks for:
| Measure | What it is | What a fitter looks for |
|---|---|---|
| Total saddle load | All the force on the saddle | How much weight the saddle carries rather than the hands and feet |
| Contact area | The area of loaded sensors | Broad support, or a small area carrying everything |
| Peak pressure | The highest single reading | Hot spots, under the sit bones or further forward in soft tissue |
| Front-to-back split | Load ahead of and behind a line across the saddle | Whether the rider sits on the nose or on the wide part |
| Left-to-right split | The share on each side | Consistent asymmetry |
| Centre of pressure | The balance point of all the pressure | Where on the saddle the rider sits |
| Centre of pressure path | How that point moves over each pedal stroke | Rocking side to side, or sliding forward |
The same rider produces very different maps in different conditions. Potter and colleagues tested 22 experienced cyclists, 11 men and 11 women, at 100 and 200 W with their hands on the tops and in the drops. More power reduced the force on every region of the saddle, as harder pedalling took more of the rider's weight onto the pedals. Moving to the drops shifted the centre of pressure forward. The women, but not the men, put more load on the front of the saddle in the drops. The women's sit bones were wider, and sit-bone width was linked to where the rear of the saddle was loaded.
Bressel and Cronin found the same pattern in peak pressure: 39% higher at 118 W on the tops than at 300 W on the tops. A map taken at an easy warm-up power with the hands on the tops can therefore look nothing like the rider's race position. A 2019 review of bike fitting by Swart and Holliday recommends mapping at an intensity similar to most of the rider's training and racing.
What causes uneven saddle pressure?
Uneven saddle pressure has several possible causes, from saddle height, tilt and rotation to cleat set-up, a difference between the legs or a saddle narrower than the sit bones. A pressure map shows what is happening, not why, so the fitter tests the causes one at a time.
These are the common patterns and what to check for each:
| What the map shows | Possible reasons to check |
|---|---|
| Load concentrated at the front, centre of pressure well forward | A long or low front end, saddle tilt, saddle shape, or the rider sliding forward |
| A wide side-to-side path of the centre of pressure | Saddle too high, a leg-length difference, cleat set-up, fatigue late in the test |
| A steady left-right imbalance | Saddle rotated or off-centre, a difference between the legs or hips, stiffness or pain on one side |
| High pressure on the sit bones and the rider keeps shifting back | A saddle narrower than the rider's sit bones |
| Load creeping forward as the test goes on | Fatigue, or a position the rider cannot hold |
Saddle shape changes posture as well as pressure, so test saddles in the rider's real position. Bressel and Larson had 20 female cyclists ride three saddles: a standard one, one with a partial cutout and one with a complete cutout. The cutouts increased forward pelvic tilt by 8% and 16%, and 55% of the riders ranked the partial cutout most comfortable. Carpes and colleagues found that for men, leaning the trunk forward changed the pressure on a saddle with a hole, but made no clear difference for women.
Phil Burt, former lead physio at British Cycling, makes the same point from the fitting side. The saddle has to be in the right place before any saddle can work, and a rider who keeps shifting backwards may need a wider one. An asymmetry that persists after the bike is set up straight is worth a look from a physiotherapist, which is where a physio and bike fitter working together help most.
What are the limits of saddle pressure mapping?
Saddle pressure mapping cannot measure comfort, rubbing and heat, or what happens to nerves and blood vessels under the skin. A test also captures a few minutes on a trainer, not hour four on the road, and the mat and the shorts' pad change the picture.
A good fitter is as clear about the limits as about the picture:
- Rubbing and heat. Mats measure pressure pressing in, not the sideways shear and friction that chafe skin. Burt has written that heat, moisture, pressure and friction together break skin down, which is why indoor riders often suffer more and why he suggests a fan pointed at the saddle area.
- What happens under the skin. A map shows pressure at the surface, not whether a nerve or a blood vessel is being squeezed. Numbness or pain that persists belongs with a doctor or physiotherapist.
- Comfort itself. The rider's report is the outcome that counts. Lower numbers do not mean a comfortable saddle.
- Hour four. A test captures minutes. Fatigue changes how a rider sits, and so does riding out of the saddle on the road.
- The mat. It adds a layer between rider and saddle, and the shorts' pad changes the map too.
- The road. On a trainer the bike does not move. Burt has noted that anything that lets the rider move changes saddle pressure a lot, and suggests standing for a couple of seconds every ten minutes indoors.
How do you test a saddle change with a pressure map?
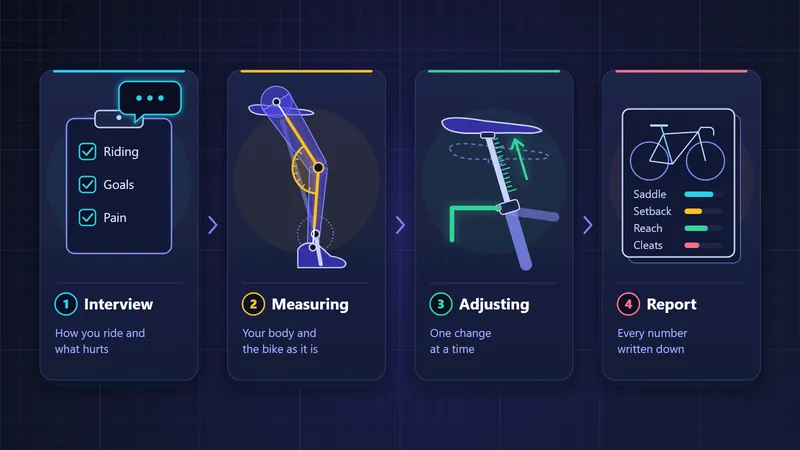
Test a saddle change by comparing two captures in the same session, with one thing changed. Keep the shorts, the mat set-up and the stages of power and hand position the same. Repeat the first stage at the end to check for drift, and ask the rider again after a few weeks of real rides.
A pressure map is most useful as a comparison, so make the comparison fair:
- Same kit. The same shorts and pad for every capture, the saddle's position marked and photographed.
- Same mat set-up. The mat placed and zeroed the same way, with the rider off the saddle, and the system's settings written down.
- Warm up first. Ten minutes of easy riding so the rider settles.
- Capture in stages. Record the last minute of each stage in the table below, at the rider's usual cadence.
- Change one thing. Then repeat the same stages in the same session.
- Repeat the first stage at the end. If it has drifted, the rider has tired or moved, and the comparison needs care.
- Ask again later. A follow-up after a few weeks of real rides tells you whether the change helped.
| Stage | Hands | Power | Time |
|---|---|---|---|
| 1 | Hoods | Endurance, around 65% of FTP | 3 minutes |
| 2 | Hoods | Just below threshold, about 90% of FTP | 3 minutes |
| 3 | Drops, or extensions on a time trial bike | Race or endurance power | 3 minutes |
| 4 | Hoods | As stage 1, to check for drift | 2 minutes |
Here is an illustrative example. Before the change, stage 1 showed 55% of the saddle load on the right, a centre of pressure 12 mm right of the saddle's centre line and a path twice as wide as in stage 2. The fitter found the saddle rotated 2 degrees and set it straight. The rerun showed 51% on the right and a narrower path. Those numbers, the photos and the rider's comfort score went into the fit record, ready for the follow-up.
Keep the summary with the fit, not in the mat's software alone, so the next fitter can read it. In Velograph a fit stores the rider's complaints by body area with a score from 0 to 10, so the follow-up asks about the same saddle discomfort and shows whether it eased. Our articles on bike fit history and bike fitting software cover keeping those records, and saddle height explains the first adjustment to check.
Further reading
- Bicycle seat interface pressure: reliability, validity, and influence of hand position and workload, Journal of Biomechanics, 2005.
- Gender differences in bicycle saddle pressure distribution during seated cycling, Medicine and Science in Sports and Exercise, 2008.
- Bicycle seat designs and their effect on pelvic angle, trunk angle, and comfort, Medicine and Science in Sports and Exercise, 2003.
- Cycling biomechanics optimization: the (r)evolution of bicycle fitting, Current Sports Medicine Reports, 2019.
- Forget aero, shorten your crank arms and point a fan at your bum: a bike-fit expert's tips for your best indoor cycling season yet, Cycling Weekly, 2025.
Velograph is not affiliated with, sponsored by or endorsed by any team, rider or company named in this article. Names are used only to refer to publicly reported work.