How aerobic decoupling is worked out from power and heart rate, where the 5% guideline comes from, a test you can repeat, and what spoils the result.
Aerobic decoupling is how far your heart rate drifts up against your power during a long, steady ride. You measure it as the fall in watts per heartbeat from the first half of the ride to the second. A fall of under 5% is the commonly quoted sign of good aerobic endurance at that intensity. A bigger fall points to heat, too little to drink, a pace above your aerobic threshold (the top of the easy zone) or a base that is not built yet. It is one of the few fitness checks you can read from an ordinary endurance ride.
How do you calculate aerobic decoupling?
Divide average power by average heart rate in each half of the ride's steady part. The decoupling is how much that ratio fell, as a share of the first half's ratio.
Power measures the work you do, and heart rate shows what that work costs your body. Over hours at the same watts, heart rate creeps up, so you get less power for each heartbeat and the two numbers come apart, or decouple. Heart rate vs power explains what each number is good for on its own.
The calculation has four steps:
- Take the steady part of the ride, after the warm-up and before the cool-down.
- Split it at the halfway point in time.
- For each half, divide average power by average heart rate. The result is watts per heartbeat.
- Subtract the second half's ratio from the first, divide by the first, and multiply by 100.
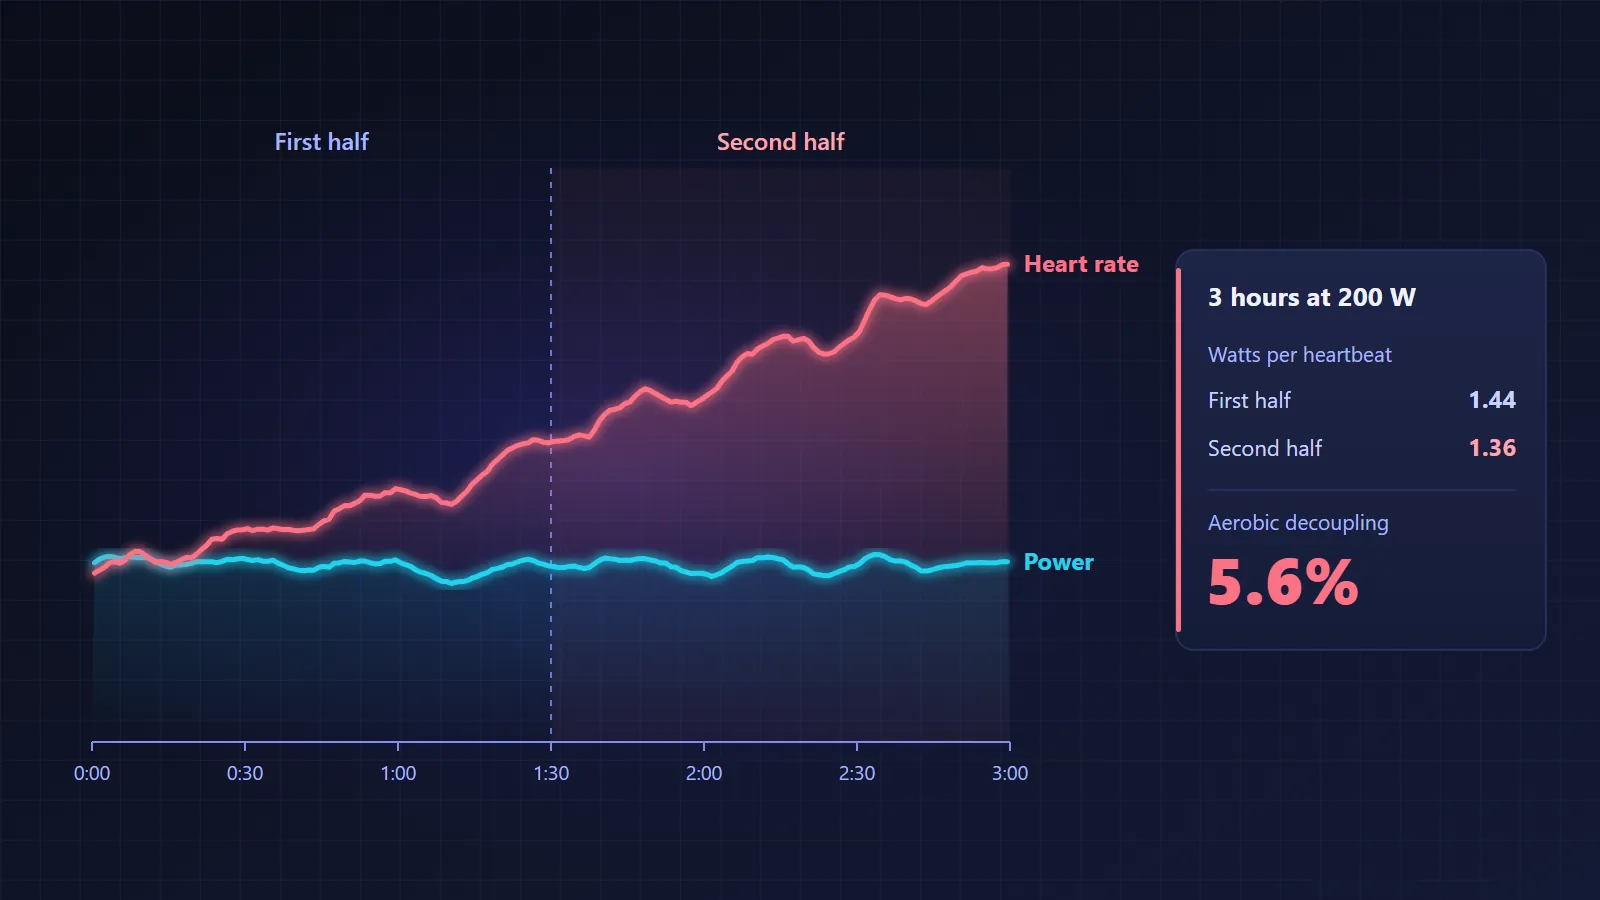
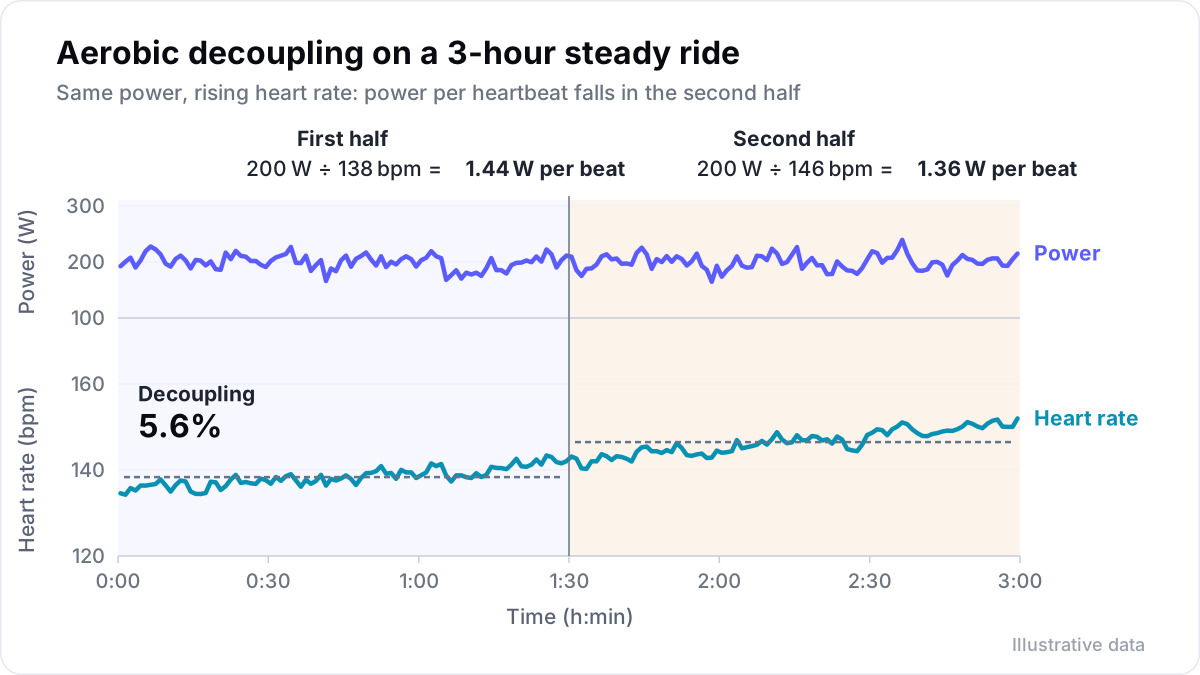
Take the ride in the diagram below: three hours at a steady 200 W. Heart rate is in beats per minute (bpm).
| Half | Average power | Average heart rate | Watts per beat |
|---|---|---|---|
| First 90 minutes | 200 W | 138 bpm | 1.44 |
| Second 90 minutes | 200 W | 146 bpm | 1.36 |
The ratio fell by 0.08 watts per beat, and 0.08 ÷ 1.44 gives a decoupling of 5.6%. The averages in the table are rounded to whole numbers; the ratios come from the unrounded ride data.
TrainingPeaks shows the result as Pw:Hr (power to heart rate) for rides and Pa:Hr (pace to heart rate) for runs. Others call it heart-rate drift. Normalized watts, an average that gives hard efforts more weight, can stand in for average power. On a steady ride the two are almost the same. Compare numbers from one tool, not across tools.
A negative result means power per beat rose in the second half. On a steady ride that usually means the halves were not alike. More freewheeling or stops in the first half, for example, count as zero watts while the heart keeps beating.
What is cardiac drift?
Cardiac drift, or cardiovascular drift, is the steady rise in heart rate at a fixed effort during long exercise. Decoupling is one way to measure it on a ride.
In a 2001 review, Edward Coyle and José González-Alonso described the drift as a gradual fall in the blood pumped with each beat. It starts after 10 to 20 minutes of exercise. They argued that a heart rate rising with body temperature, more than extra blood flow to the skin, explains that fall.
Drift is not only noise. In a 2005 study, Wingo and colleagues had nine male cyclists ride at a steady, moderate intensity in 35 °C heat. Between minutes 15 and 45, heart rate rose from 151 to 169 bpm. Their maximal oxygen uptake (VO2max) was 19% lower at minute 45 than at minute 15. The same work had gone from 63% to 78% of their maximum. A heart rate rising at fixed watts means the ride is getting harder for the body.
Where does the 5% decoupling rule come from?
The 5% figure comes from Joe Friel, the endurance coach and author of The Cyclist's Training Bible, in an article for TrainingPeaks first published in 2008 and updated since. He sorts the result into three bands.
| Decoupling | Friel's reading |
|---|---|
| Under 5% | Good aerobic endurance at that intensity |
| 5 to 10% | Some limits to endurance, or fatigue |
| Over 10% | The ride was probably above the aerobic threshold, or longer than current endurance supports |
Friel uses steady rides at the aerobic threshold, the first of the two thresholds in cycling training zones. Their length, not counting the warm-up and cool-down, depends on the race you train for:
| Your target race | Length of the steady test |
|---|---|
| Under 2 hours | About 2 hours |
| 2 to 4 hours | As long as the race |
| Over 4 hours | 4 hours |
Read the guideline as a coaching rule of thumb. The article cites no study for the 5% cut-off, and on the length of the ride it says there is no hard research-based rule.
How do I test my aerobic endurance?
Ride a steady block at your aerobic threshold power, on flat roads or a trainer, and work out its decoupling. A planned test gives a cleaner number than an everyday ride. Repeat it every four to six weeks during base training, on the same course or trainer.
- Set the power at your aerobic threshold and use the same watts every time. Zone 2 training shows how to find it.
- Pick the length from Friel's table, or a shorter one you keep.
- On a trainer, use ERG mode, which holds the power fixed.
- Keep everything else the same: the time of day, breakfast, coffee, drinks, food and fan.
- Warm up for 15 to 20 minutes, then press the lap button.
- Ride steadily, with no stops or surges and an even cadence.
- Press the lap button again to end the block, then cool down.
Log each test the same way: date, temperature, target watts, watts per beat in each half, the decoupling and average cadence. Cadence is on the list because of a 2026 study in which 17 trained cyclists rode 60 minutes at 75% of their FTP each month for five months. The more their cadence fell in the second half, the more they decoupled, by about 0.6 percentage points for each rpm lost.
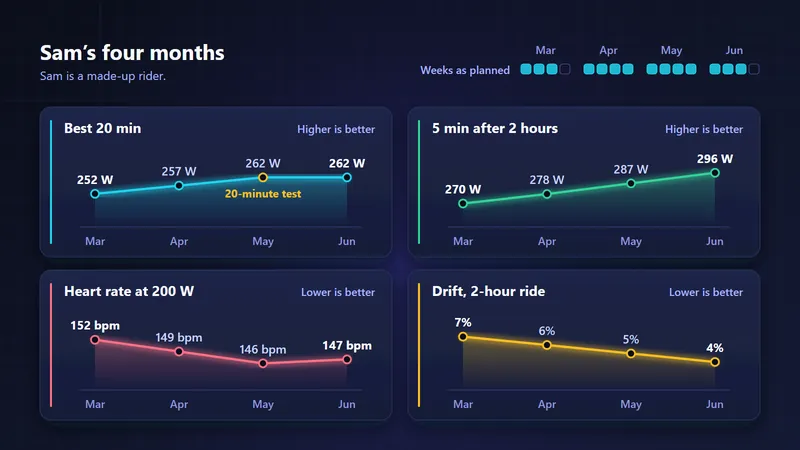
Flat, unbroken long rides give a usable number between tests. Velograph shows heart-rate drift on every ride of 20 minutes or more with power and heart rate. Drag across the ride chart to measure only the steady stretch, without the warm-up. The rider overview shows power per heartbeat week by week and the typical drift of the last four weeks' long, steady rides. Velograph for riders describes what a rider gets on their own.
What affects aerobic decoupling?
Heat, fluid loss, an uneven ride, fatigue and a faulty heart-rate strap all move decoupling as well as fitness. A fair test keeps each of them out.
| What changes | What it does to decoupling | How to keep it out |
|---|---|---|
| Heat | Raises it, sometimes a lot | The same room temperature and fan; no hot days |
| Too little to drink | Raises it in step with the fluid lost | The same drinking plan each time |
| The warm-up counted in the first half | Skews it, because heart rate has not settled | Measure the steady block only |
| Surges, hills, stops, freewheeling | Make the halves unlike each other | Flat roads or the trainer; pedal steadily |
| Fatigue, a short night, illness | Shifts heart rate either way | Test after an easy day; skip it when unwell |
| Caffeine | Little effect on heart rate in short studies | The same amount at the same time |
| A heart-rate strap that drops out | Spikes and gaps in the data | The same strap each time; check the trace |
Fluid. In 1992, Montain and Coyle had eight trained cyclists ride two hours at a moderate intensity in 33 °C heat, drinking different amounts. They lost from 1.1% to 4.2% of their body weight, and the rise in heart rate grew almost in a straight line with the fluid lost.
Caffeine. A 2018 meta-analysis of 26 studies by Glaister and Gissane found that caffeine at 3 to 6 mg per kilo of body weight did not change heart rate during steady efforts of 5 to 30 minutes. It did make the effort feel easier. Those studies did not cover three-hour rides, so keep your coffee the same before each test.
When something is off. Sometimes your heart rate at familiar watts stays unusually high for days, with no heat or hard training to explain it, or you feel unwell. Then rest and talk to a doctor rather than testing through it.
Is aerobic decoupling the same as durability?
No, decoupling measures one part of durability, which is how much power is left late in a long ride. Decoupling shows the extra heartbeats the same power costs as the hours pass.
In 2021, Ed Maunder, Stephen Seiler and colleagues defined durability more precisely. Numbers from a fresh test, such as the power and heart rate at your thresholds, decline during a long ride. Durability is when that decline starts and how large it becomes.
In a 2022 study by Stevenson and colleagues, trained cyclists and triathletes rode two hours at a steady, moderate pace. Afterwards, the power at their first threshold had fallen from 217 to 196 W, while the heart rate at that threshold had risen from 142 to 151 bpm. Late in a long day, the same power costs more beats.
A large running study points the same way. Smyth, Maunder and colleagues compared heart rate with speed for 82,303 marathon runners in 2022. The runners who decoupled least, about a third of them, finished in about 217 minutes on average. The third who decoupled most took about 239 minutes. Read running data as a pointer for cyclists, not a rule.
The two measures answer different questions. Decoupling asks what steady riding costs you; a durability test asks what power is left for a climb or an attack after hours in the saddle. Low drift does not prove the second. Durability in cycling shows how to measure it.
Common questions
Is 5% aerobic decoupling good?
Under 5% is Friel's sign of good aerobic endurance at that intensity, on a steady ride as long as your target race, up to four hours. A fall from 8% to 5% over a base period says more than the number on its own.
Can I measure decoupling indoors?
Yes, and a trainer keeps the power steadier than any road. With no wind to cool you, keep the fan, the room and the drinks the same for every test, and do not compare indoor numbers with outdoor ones. Indoor cycling training covers fans and heat.
Further reading
- Aerobic decoupling and heart rate drift explained, Joe Friel, TrainingPeaks, 2008, updated 2026.
- Cardiovascular drift during prolonged exercise: new perspectives, Coyle and González-Alonso, Exercise and Sport Sciences Reviews, 2001.
- Cardiovascular drift is related to reduced maximal oxygen uptake during heat stress, Wingo and colleagues, Medicine and Science in Sports and Exercise, 2005.
- Decoupling of internal and external workload during a marathon: an analysis of durability in 82,303 recreational runners, Smyth and colleagues, Sports Medicine, 2022.
Velograph is not affiliated with, sponsored by or endorsed by any team, rider or company named in this article. Names are used only to refer to publicly reported work.