ERG mode, trainer power against pedal power, heat and fans, indoor and outdoor FTP: how to get numbers from the smart trainer that you can trust.
Indoor cycling training gives you the most controlled ride data you will ever collect: no traffic lights, no descents, no wind. The numbers only count if you know three things. Your smart trainer measures power at a different place from a power meter on the bike, so the two rarely agree exactly. Heat indoors lowers the power you can hold and raises your heart rate. And at the same effort, many riders produce less power indoors than outdoors. Control those three, and an hour on the trainer becomes your most precise training session of the week.
Why train indoors on a smart trainer?
A smart trainer lets software set the resistance, so you can ride controlled intervals at home on an ordinary evening. The data is steadier indoors too, which makes the trainer suit tests and precise intervals.
For decades the turbo trainer was a winter punishment. Smart trainers changed that by letting software set the resistance. Zwift opened an invite-only beta in September 2014 and launched as a paid product in October 2015. It made indoor riding social: group rides, races and, from 2020, the UCI Cycling Esports World Championships, first held on Zwift that December. Its Zwift Academy programme even turned trainer data into professional contracts; the story is told in talent identification in cycling.
TrainerRoad built its service around structured, power-based workouts and training plans, and other apps followed. The result is that controlled intervals, once a laboratory luxury, became an ordinary Tuesday evening for amateur riders.
Indoors also removes most of the noise in the data. In a study by Jeffries and colleagues (2019), 20 competitive cyclists rode a 20-minute time trial outdoors and on a laboratory ergometer. Average power was almost identical, 284 W outdoors and 280 W indoors, but each rider's power varied about twice as much outdoors (a standard deviation of 69 W against 33 W). That steadiness is why the trainer suits tests and precise intervals so well.
What is ERG mode on a smart trainer?
ERG mode makes a smart trainer hold your target power whatever your cadence or gear. It suits steady intervals, sweet spot and endurance blocks. Resistance mode keeps a fixed resistance instead, and slope mode mimics a gradient.
How the trainer sets resistance decides what your session trains and what your data means.
| Mode | What the trainer does | Use it for | Watch out for |
|---|---|---|---|
| ERG | Holds the target power whatever your cadence or gear | Steady intervals, sweet spot, endurance blocks | Slow response to sudden changes; cadence collapse when tired |
| Resistance (level) | Keeps a fixed resistance; power comes from your gear and cadence | FTP tests, all-out efforts, sprints | You must pace yourself |
| Slope (simulation) | Mimics a gradient, as in virtual worlds | Group rides, races, pacing practice | Power depends on gearing, like outdoors |
ERG mode is excellent for hitting targets, but it has two known weaknesses. It reacts slowly to big changes in target power, so short sprints rarely start where they should. And when fatigue makes your cadence drop, the trainer adds resistance to hold the watts, which drops your cadence further. Riders call this the spiral of death. Start hard intervals at a comfortably high cadence to leave room.
When should you turn ERG mode off?
Turn ERG mode off for tests and maximal efforts, because ERG would cap the very effort you are trying to measure. Ride them in resistance or slope mode. It also pays to ride some interval sessions without ERG. Pacing an interval yourself is a skill, and races do not come with automatic resistance.
Why does my smart trainer read lower than my power meter?
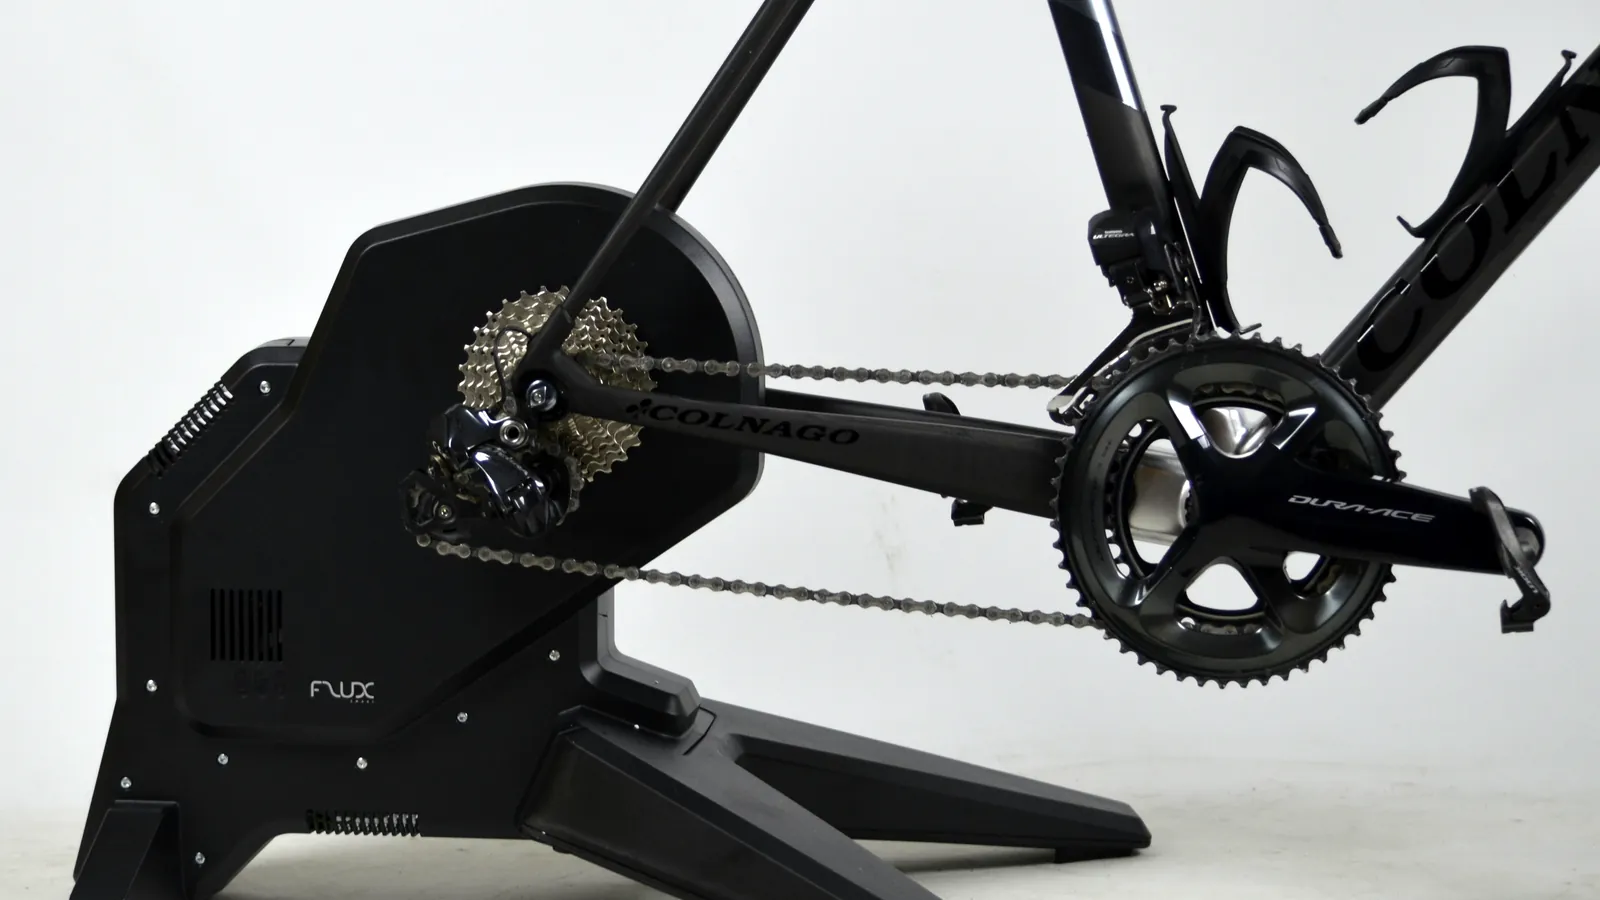
A direct-drive smart trainer measures power at its hub, after the chain and cassette have taken their share, while a power meter measures at the pedals, cranks or spider. So a trainer reading a few percent below a pedal meter is normal.
Laboratory tests at Johns Hopkins University found a bicycle chain drive up to about 98.6% efficient, with more loss on smaller sprockets. A dirty or worn drivetrain widens the gap.
Each device also has its own tolerance. Wahoo, for example, quotes ±1% for its fifth-generation KICKR, tightened from ±2% on the model before. Two devices that are each within their claims can still differ by a couple of percent.
A worked example shows why this matters. Suppose your FTP of 260 W was set with pedals outdoors, and a side-by-side check shows your trainer reads 3.2% lower (239 W on the trainer when the pedals say 247 W). If you ride a 250 W threshold interval in ERG mode controlled by the trainer's reading, your legs are producing about 258 W. Every interval is about 3% harder than planned, and over a block of threshold work that adds up.
Keep one source of truth for your zones. If your app allows it, record power from the same meter you use outdoors. Then calibrate both devices in the same way every time:
- Warm the trainer up for about 10 minutes, then run its spin-down calibration if your model needs one.
- Zero the power meter (zero offset) before each ride, with the crank unloaded.
- Once a month, ride three steady five-minute blocks at easy, moderate and threshold power, record both devices and note the difference.
- If the gap changes suddenly, clean the chain and check the cassette before blaming the electronics.
Why do you need a fan for indoor cycling?
You need a fan indoors because the air around you warms up within minutes, and heat lowers the power you can hold. Outdoors, you ride in your own wind, and indoors a strong fan pointed at your torso takes its place.
Tatterson and colleagues (2000) had 11 riders from the Australian national road squad ride 30-minute time trials at 32 °C and at 23 °C: power was 6.5% lower in the heat. Bright and colleagues (2023) showed what a fan does. In a 700 kJ time trial at 32 °C, trained cyclists averaged 232 W in still air but 247 to 250 W with airflow of 16, 30 or 44 km/h. More airflow than 16 km/h added no further benefit in that study.
The practical lessons are plain. Use at least one strong fan pointed at your torso, keep the room as cool as you can, drink to plan, and write the room temperature in your ride notes. If your power is down and your heart rate is up on a warm evening, check the thermometer before you question your fitness.
Heat also distorts heart rate. How far heart rate rises at steady power, called cardiac drift, says something useful about aerobic fitness outdoors, but indoors it partly measures your fan. Compare heart-rate drift only between rides in similar conditions; the article on heart rate vs power explains how to read it.
Why is my FTP lower indoors than outdoors?
Many riders test lower indoors, most likely because of heat, motivation or a different power source. When riders go all-out in a controlled laboratory, as in the Jeffries study, indoor and outdoor power can be very close. When they ride to feel, the gap opens.
Mieras and colleagues (2014) asked 12 cyclists to ride 40 km at the same perceived effort indoors and outdoors. They averaged 208 W outside against 163 W in the laboratory, about 27% more. Their skin was warmer indoors (33.0 °C against 31.4 °C).
So decide which question you are asking. If you want one FTP for everything, test in conditions you can repeat: same trainer, same mode, same fan set-up, same power source. If, after controlling all that, you are still consistently lower indoors, use a separate indoor FTP for indoor sessions. What is FTP? covers the test protocols.
| What you see | Likely cause | What to do |
|---|---|---|
| Indoor test 5 to 10% lower than outdoors | Heat, motivation, a different power source | Add airflow, test with the same meter, retest |
| Trainer reads consistently 2 to 4% below pedals | Drivetrain loss, tolerance | Pick one source for zones and stick to it |
| Gap between devices changes from ride to ride | Calibration, temperature, dirty chain | Warm up, spin down, zero offset, clean the drivetrain |
| Heart rate higher indoors at the same power | Heat and little airflow | More fan, cooler room, compare like with like |
Is an hour indoors the same as an hour outdoors?
An indoor hour is not the same as an outdoor hour. On the trainer you pedal almost all the time, while outdoor rides include freewheeling on descents and at junctions. Training load based on power counts both fairly, but only if both kinds of ride sit in the same place, measured in the same way.
Save the original file of every indoor ride, mark it as indoor and note the trainer, the mode, the power source and the room temperature. Over a season, that turns into a useful comparison: how your indoor and outdoor power at the same heart rate move together, and whether your indoor tests still predict your outdoor racing. When you build a structured training plan, you can then place the precise intervals indoors and the long rides, skills and race rehearsals outdoors.
In Velograph, indoor and outdoor rides sit side by side in one record, whether they arrive as FIT files or from intervals.icu or Strava.
A checklist before every indoor session
- Fan on and aimed at your torso; room temperature noted.
- Drivetrain clean; trainer warmed up, then spin-down if your model needs it.
- Power meter zeroed; the same power source as the one your zones came from.
- ERG for steady intervals, resistance or slope mode for tests and sprints.
- A full bottle per hour, and a towel.
- Heart rate strap on, so you can compare cost against output.
- The ride saved as an original file, with notes on mode, power source and temperature.
Further reading
- An analysis of variability in power output during indoor and outdoor cycling time trials, International Journal of Sports Physiology and Performance, 2019.
- Physiological and psychological responses to outdoor vs. laboratory cycling, Journal of Strength and Conditioning Research, 2014.
- Influence of air velocity on self-paced exercise performance in hot conditions, Medicine and Science in Sports and Exercise, 2023.
- ERG mode explained: what it is, how to use it and when you should turn it off, BikeRadar, 2023.
Velograph is not affiliated with, sponsored by or endorsed by any team, rider or company named in this article. Names are used only to refer to publicly reported work.