Which numbers show that your cycling is improving, in order of how far to trust them, with a fair retest, a monthly table to copy and normal plateaus.
To measure cycling progress, compare yourself with your own earlier numbers, recorded the same way. The signs to trust most are new bests on your power curve at 5 seconds and 1, 5, 20 and 60 minutes, and a retest ridden under the same conditions. Lower heart rate at the same power, less heart-rate drift on long steady rides and more power late in long rides come next. Average speed counts only on the same route in the same weather. Check once a month, and expect flat spells.
What are the signs your cycling is improving?
Your cycling is improving when your power curve shows new bests at durations you rode all-out, a fair retest rises by more than the test's own noise, your heart rate is lower at the same power, and you keep more power late in long rides.
Trust them roughly in this order, and only on rides that can be compared.
| Sign | How to see it | How far to trust it | How often to check |
|---|---|---|---|
| New power bests | Best 5 s, 1, 5, 20 and 60 min | High, at durations ridden all-out | Monthly |
| A fair retest | The same test, device and conditions | High, when the change is above about 3% | Every 6 to 8 weeks |
| Heart rate at a fixed power | The same steady effort in the same conditions | Medium, because heat, sleep and caffeine move it | Every 2 to 4 weeks |
| Less heart-rate drift | Decoupling on a 2-hour steady ride | Medium | Monthly |
| Power late in long rides | Best 5 min after about 2 hours | Medium, because it needs long rides with a hard finish | Monthly in the long-ride months |
| Consistency | Weeks with the key sessions done | It causes progress rather than showing it | Weekly |
| Average speed | One route, calm weather, the same bike and position | Low | Rarely |
How do you use your power curve to track progress?
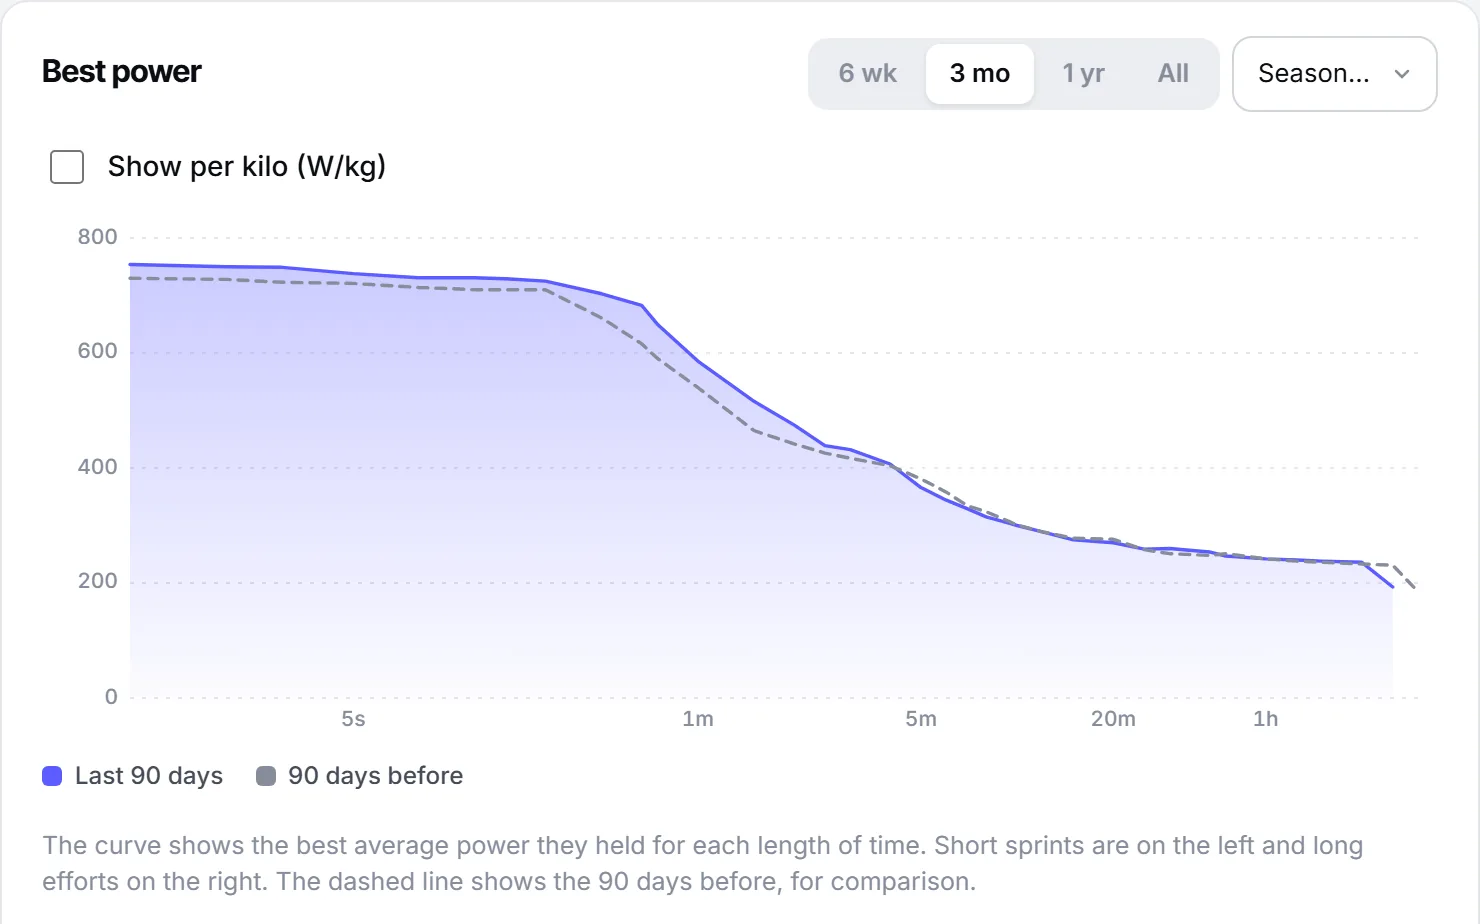
Compare your best power at 5 seconds and 1, 5, 20 and 60 minutes with the same durations three months or a season earlier. A higher best at a duration you rode all-out is real progress. A lower best at a duration you did not ride hard is only untested.
Sports scientists call this record of best efforts the record power profile. Julien Pinot and Frédéric Grappe (2011) built it from every ride and race of 17 elite and professional cyclists over a ten-month season. Sprinters, climbers and flat specialists had differently shaped profiles, and the authors proposed the profile for evaluating performance from field data. Their six-season case of one rider, in data-driven training, followed the same kind of profile year by year.
Here is a made-up rider, Sam, three months apart.
| Duration | Three months ago | Now | Change | Ridden all-out lately? | Reading |
|---|---|---|---|---|---|
| 5 s | 920 W | 905 W | −2% | No sprints | Untested |
| 1 min | 480 W | 496 W | +3% | Yes, in a race | Progress |
| 5 min | 300 W | 312 W | +4% | Yes, on a climb | Progress |
| 20 min | 252 W | 262 W | +4% | Yes, in a test | Progress, if the test was fair |
| 60 min | 230 W | 224 W | −3% | No | Untested |
If your weight has changed, compare watts per kilo as well. The guide to the power curve shows how to tell a real weakness from an untested duration.
How do you know a test result is real progress?
A test result is real progress when you rode the same protocol, on the same device and in the same conditions, and the change is larger than the test's own day-to-day noise. For a 20-minute test, that noise is about 3%, or about 7 W for a rider who averages 250 W.
Borszcz and colleagues (2020) had 25 trained cyclists ride a practice test and then two 20-minute tests a week apart. Their 20-minute power varied by 2.9% between the two tests. A rise from 250 to 255 W can be noise. A rise to 262 W probably is not, especially when the next test agrees.
A fair retest keeps the test, the power meter, the warm-up, the time of day, how rested you are and the place the same. The retest checklist in how to increase FTP goes through each one, and what FTP is explains why a ramp test and a 20-minute test give different numbers. Test at the end of an easier week, not two days after a race, and compare indoor tests only with indoor tests.
Write the conditions in your training diary, so that an odd result can be explained.
Can heart rate show that your fitness is improving?
Yes, if you ride the same steady effort every few weeks in the same conditions and compare your heart rate. A lower heart rate at the same power, or more power at the same heart rate, means your aerobic fitness has improved. Heat, short sleep, caffeine and too little fluid all raise heart rate.
In a 2014 review, Martin Buchheit described heart rate during a fixed, moderate effort as one of the most sensitive heart-rate signs of better aerobic fitness. It also varies by about 3% from day to day, so look for a change that repeats. Heart rate takes 3 to 4 minutes to settle, so compare the last minute of each steady block.
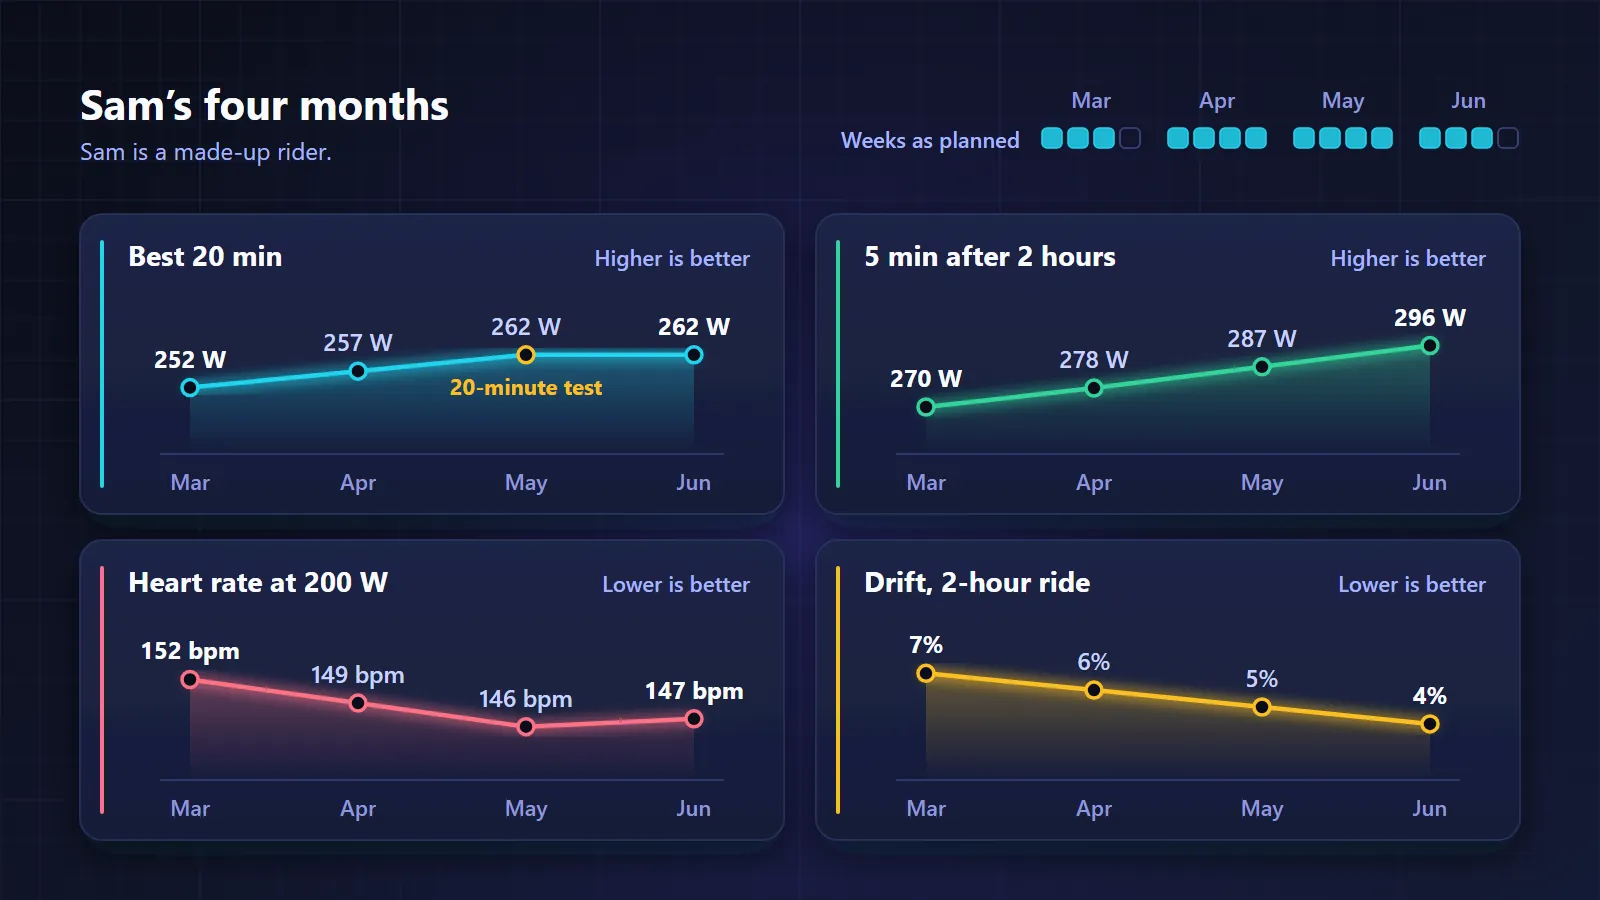
Here is a test to copy. After a 15-minute warm-up, ride 20 minutes at 200 W and note the average heart rate of the last minute. Sam's was 152 bpm in March and 146 bpm in May, about 4% lower, which is more than the day-to-day noise. June's 147 bpm agreed. Without a power meter, ride a flat road in calm weather, or the same trainer setting, at a fixed heart rate and compare speed.
On long steady rides, heart-rate drift adds a second view. If your heart rate climbs less in the second hour of an even two-hour ride, your endurance is improving; Sam's drift fell from 7% in March to 4% in June. The test and its 5% guideline are in aerobic decoupling, and heart rate vs power describes a short heart-rate test from research.
How do you know your endurance is getting better?
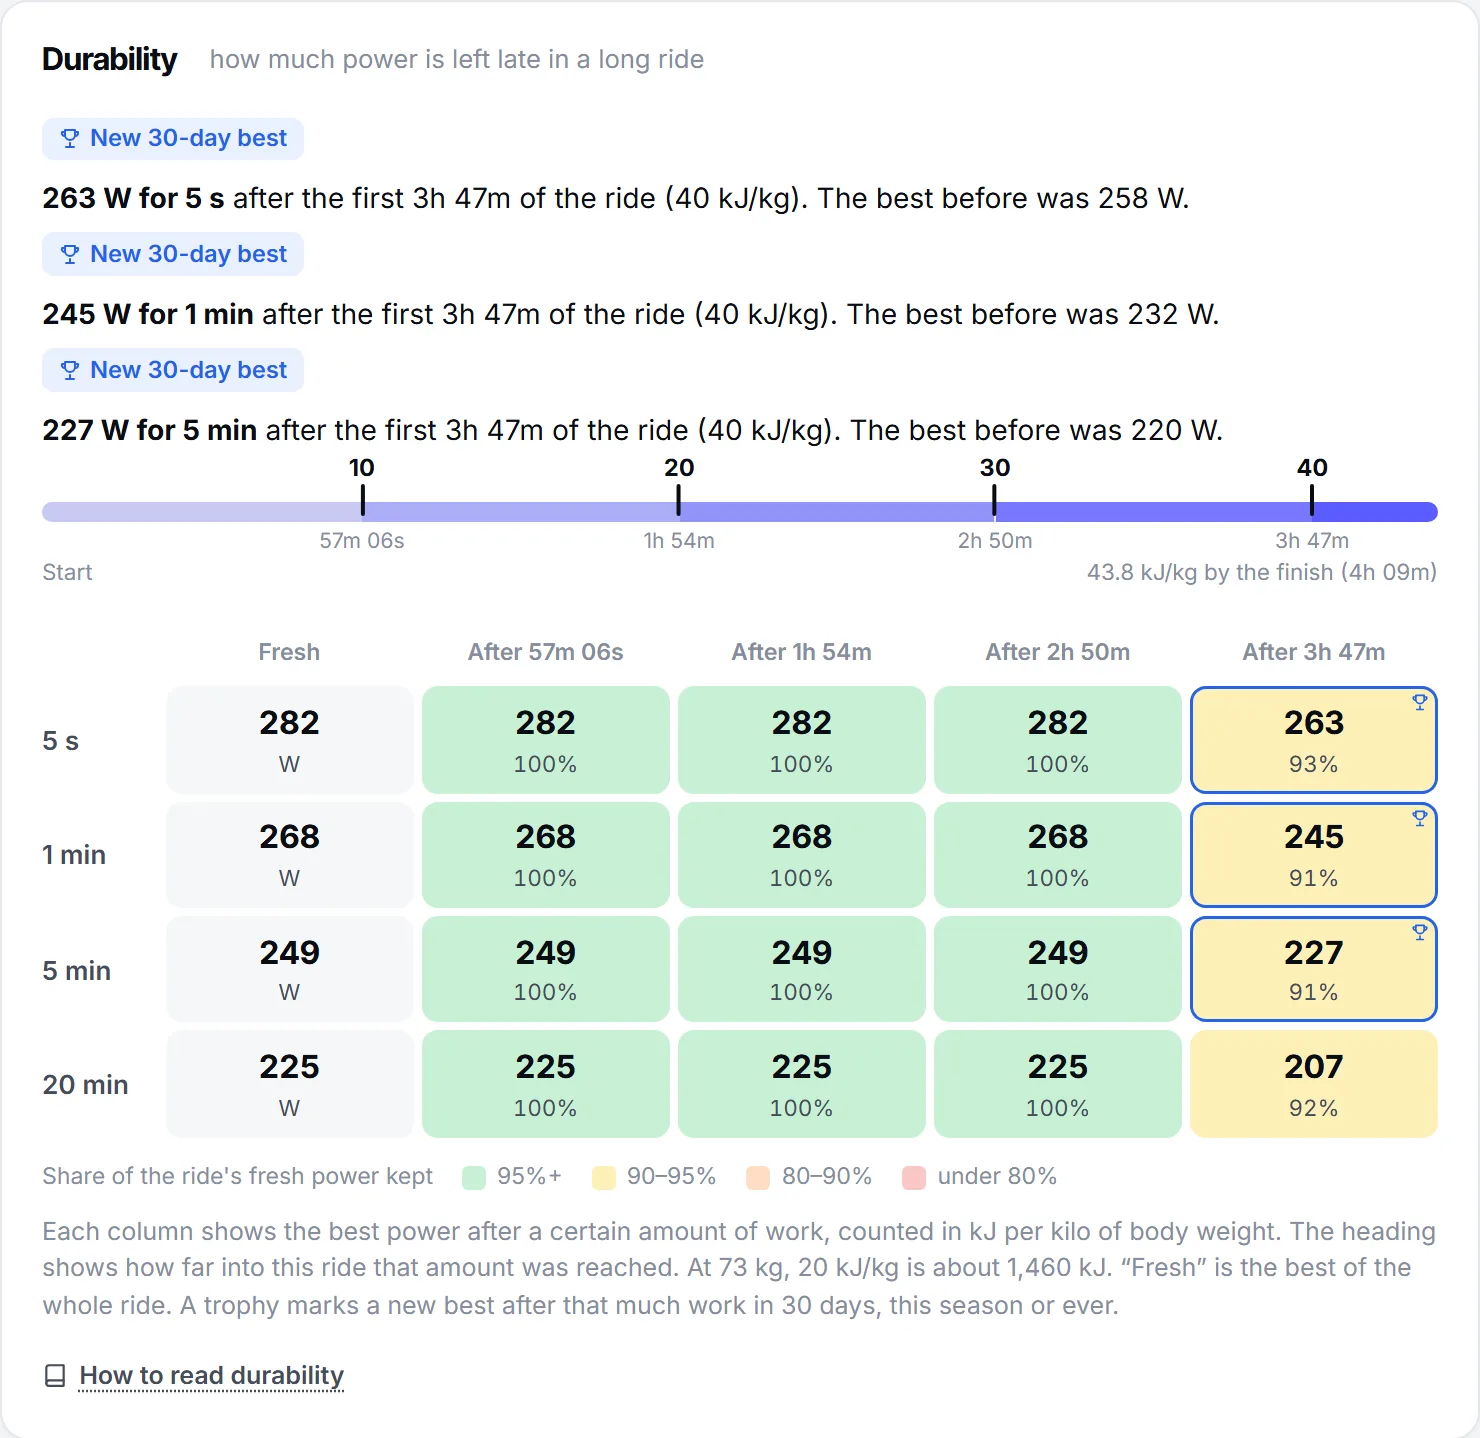
Your endurance is getting better when you keep more of your fresh power late in long rides. Compare your best 5 minutes after about 2 hours of riding with your fresh best 5 minutes. When the gap closes over weeks, your durability is improving.
In March, Sam's best 5 minutes after 2 hours was 270 W, 90% of a fresh 300 W. In June it was 296 W, 95% of a fresh 312 W. Check this only on rides long enough to have a hard effort near the end, because a ride without one says nothing about late power. The guide to durability in cycling explains how to measure and train it.
Is average speed a good measure of cycling progress?
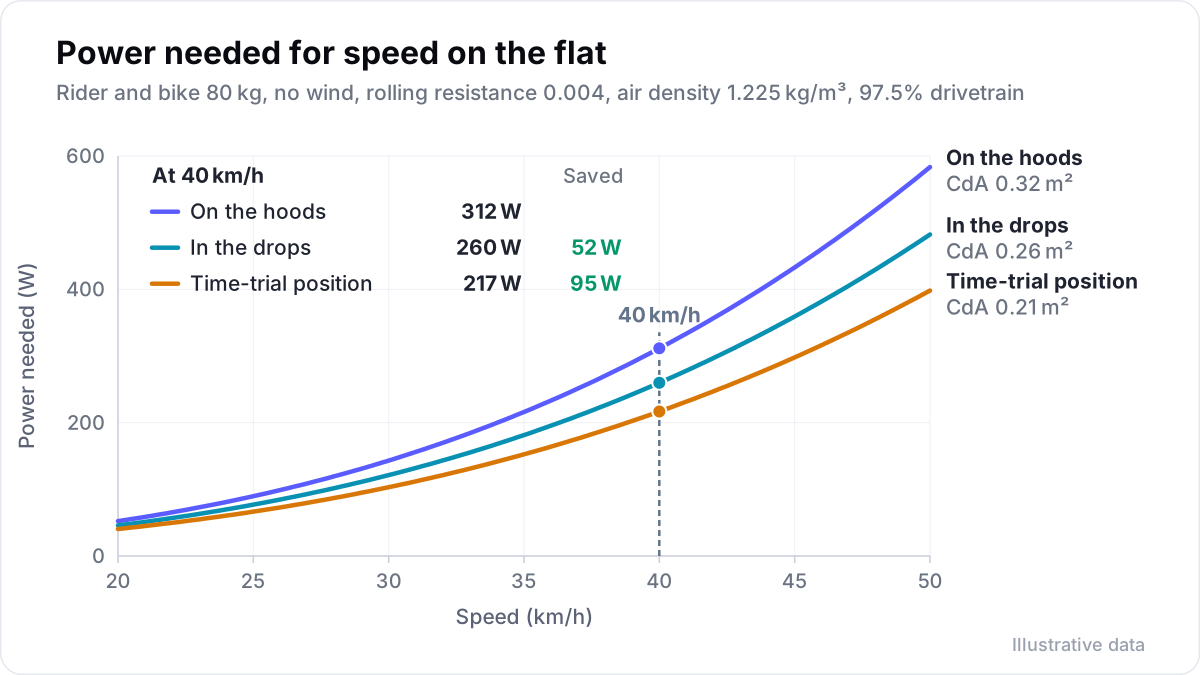
Average speed is a poor measure of progress unless the route, the weather, the bike and your position stay the same. Wind, drafting, tyres and position change speed far more than a few months of training do, so compare speed only on one route in calm conditions.
Take 80 kg of rider and bike on a flat road in still air, with the values in the chart below. The model gives about 36.9 km/h for 250 W on the hoods. Five per cent more power adds only about 0.7 km/h, but riding the same 250 W in the drops adds about 2.5 km/h. An out-and-back route does not cancel the wind either. In a 10 km/h wind, the same 250 W averages about 36.1 km/h there and back, because you spend longer riding into it.
How often should you check your cycling progress?
Look at the trend once a month and retest every six to eight weeks. Single rides move with sleep, heat and fatigue, so one says little. Expect flat spells of several weeks, especially in hard blocks, after illness and as your years of training add up.
A flat spell is normal in these cases:
- During a hard block. Fatigue hides fitness, so new bests often come after an easier week.
- After illness or a break. The numbers dip first and come back with training, as how fast you lose fitness explains.
- In winter. Short bests fall when nobody sprints, which makes them untested rather than lost.
- After years of training. Each year's gain tends to be smaller than the last.
If two months of consistent training move none of the signs, change one thing, such as more long rides or a different key session. Count your weeks too, because a week in which you rode the key sessions and the long ride is what moves every other number. A season review counts them for the whole year.
One row a month is enough. Sam's four months look like this.
| Month | Weeks as planned | Best 5 min | Best 20 min | Heart rate at 200 W | Drift, 2-hour ride | 5 min after 2 hours | Note |
|---|---|---|---|---|---|---|---|
| March | 3 of 4 | 300 W | 252 W | 152 bpm | 7% | 270 W | Cold in week 2 |
| April | 4 of 4 | 306 W | 257 W | 149 bpm | 6% | 278 W | |
| May | 4 of 4 | 312 W | 262 W | 146 bpm | 5% | 287 W | 20-minute test, 262 W |
| June | 3 of 4 | 312 W | 262 W | 147 bpm | 4% | 296 W | Race week, no test |
Velograph's free Rider plan, for example, shows season bests at 5 seconds and 1, 5, 20 and 60 minutes against last season, the power curve against an earlier period, durability on long rides, and aerobic efficiency, the power for each heartbeat on steady rides of 45 minutes or more. See what a rider gets on their own.
Further reading
- The record power profile to assess performance in elite cyclists, Pinot and Grappe, International Journal of Sports Medicine, 2011.
- Reliability of the functional threshold power in competitive cyclists, Borszcz and colleagues, International Journal of Sports Medicine, 2020.
- Monitoring training status with HR measures: do all roads lead to Rome?, Buchheit, Frontiers in Physiology, 2014.
Velograph is not affiliated with, sponsored by or endorsed by any team, rider or company named in this article. Names are used only to refer to publicly reported work.