Fresh test numbers do not win long races. What durability is, how to measure the power you keep after hours of riding, and how riders train it.
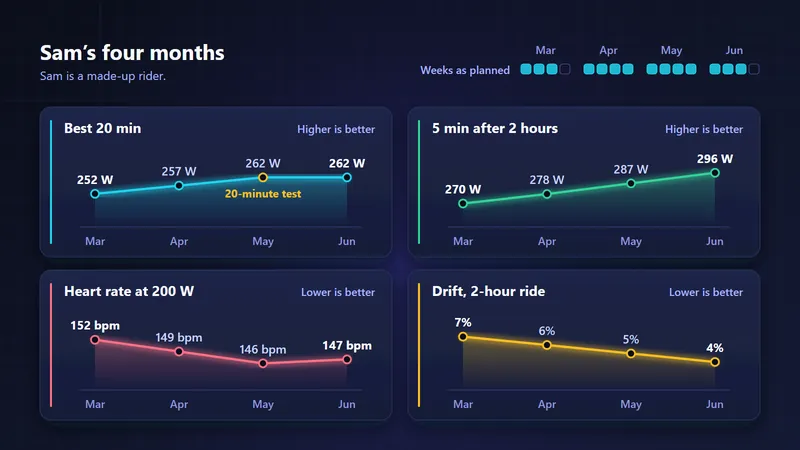
Durability in cycling is how much of your power is still there after hours of riding. Two riders with the same FTP can finish a long race very differently: one still has 95% of their best five-minute power after three hours, the other has 85% left. Long road races are usually decided in the final hour, so that late power matters more than any number you set on fresh legs in a test. The good news is that durability can be measured from ordinary ride files, and coaches have practical ways to train it.
What is durability in cycling?
Durability in cycling is how much of your fresh power is still there after hours of riding. Researchers also call it fatigue resistance or physiological resilience.
Every number in a fitness test is measured fresh: FTP, critical power, VO2max, the heart rate at your thresholds. In 2021, Ed Maunder, Stephen Seiler and colleagues argued in Sports Medicine that these numbers do not stay put during a long ride. They defined durability by when that decline starts and how large it becomes.
The decline is easy to underestimate. In a 2022 study by Stevenson and colleagues, trained cyclists and triathletes rode two hours at a steady, moderate pace. Afterwards, the power at their first ventilatory threshold (the top of the easy zone) had fallen from 217 to 196 W on average, about 10% less. The heart rate at that threshold had risen from 142 to 151 beats per minute. Zones set from a fresh test overstate what you can hold late in the day.
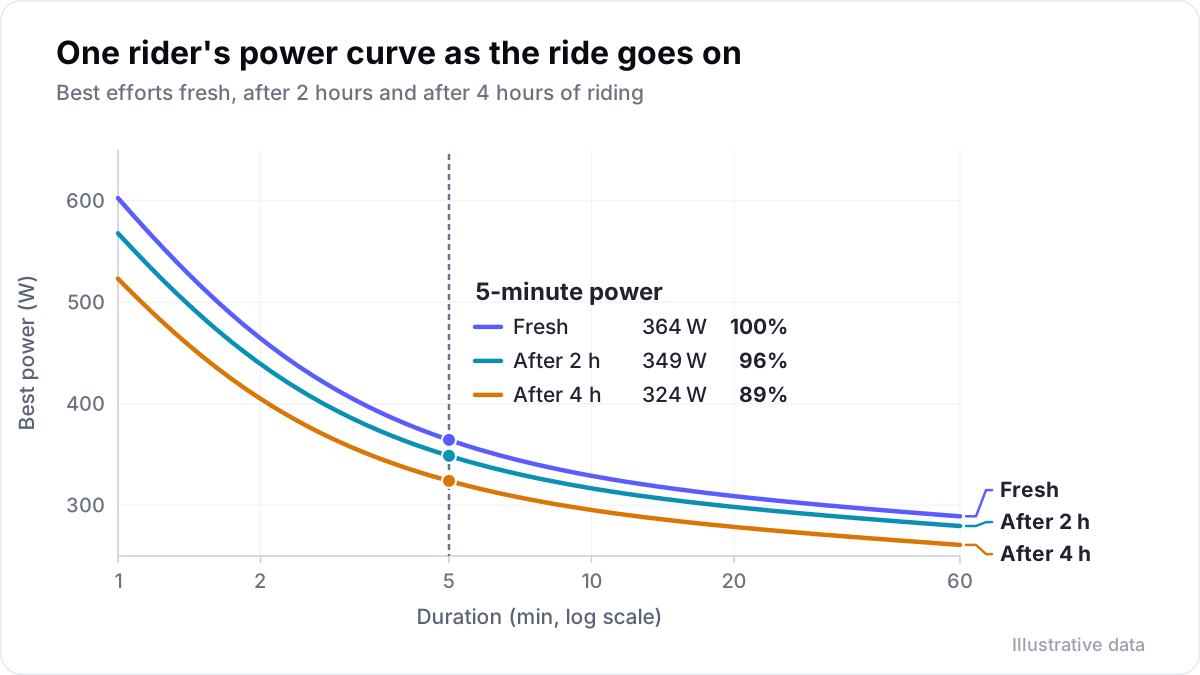
Picture your power curve drawn three times: once from fresh efforts, once from efforts that started after two hours, once after four. The fresh curve is the one you know from your power curve. The lower curves are the ones that decide a long race. A rider whose curves sit close together is durable; a rider whose curves drop apart is strong on paper and fades in the finale.
What does research say about durability in pro cyclists?
Research on professional riders shows that durability separates riders who look alike when fresh. It varies a lot between riders, and early surges cost more than steady riding with the same amount of work.
Durability has drawn a lot of research since 2021, largely because power files let researchers see what riders produced after a given amount of work in real races.
| Study | Riders | What it found |
|---|---|---|
| van Erp, Sanders and Lamberts, 2021 | 26 professionals, 85 seasons | Power fell as prior work rose from 0 to 50 kJ per kilo. More successful climbers kept more of their 5 and 20-minute power, more successful sprinters more of their 10-second and 1-minute power. |
| Leo, Spragg and colleagues, 2021 | U23 riders and professionals at the Tour of the Alps | Professionals produced more power per kilo after 1,000 to 3,000 kJ of work. The authors called this power profile a practical tool for telling professionals and U23 riders apart. |
| Valenzuela and colleagues, 2023 | 12 professionals | A 20-minute time trial fell from 386 to 375 W after about four hours of riding (about 40 kJ per kilo), 2.9% on average, but anywhere from 8.5% down to 1.1% up between riders. Laboratory tests did not predict who faded. |
| Mateo-March and colleagues, 2024 | 17 professionals | Work done above critical power lowered later power and critical power. The same amount of work done below critical power did not. |
Three lessons come out of this work. Durability separates riders who look alike when fresh. It varies a lot between individuals, so it has to be measured, not assumed from a lab test. And the intensity of the early hours matters as much as their length: an hour of surging costs more than an hour of steady riding with the same kilojoules.
How do you measure durability in cycling?
You measure durability as the share of your fresh power you can still produce after a set amount of work, such as about two hours of steady riding (20 kJ per kilo of body weight for a 70 kg rider). You can read it from the rides you already do or test it on purpose.
Durability is measured against the work already done. A power meter counts that work in kilojoules: one hour at 200 W is 720 kJ. Dividing by body weight makes riders comparable. For a 70 kg rider, 20 kJ per kilo is 1,400 kJ, which is about two hours at an average of 195 W. Forty kJ per kilo is about four hours at the same pace. A race reaches each level sooner than an easy ride does.
From the rides you already do
The simplest measure is your best five-minute power that started after 20 kJ per kilo, divided by your best fresh five-minute power over the same weeks. Do the same for one minute and 20 minutes if you have the efforts. Velograph reads this from every ride with power. It counts the work in kilojoules per kilo of body weight and shows the best 5-second, 1, 5 and 20-minute power after each level beside the fresh numbers. It also says how far into the ride each level came.
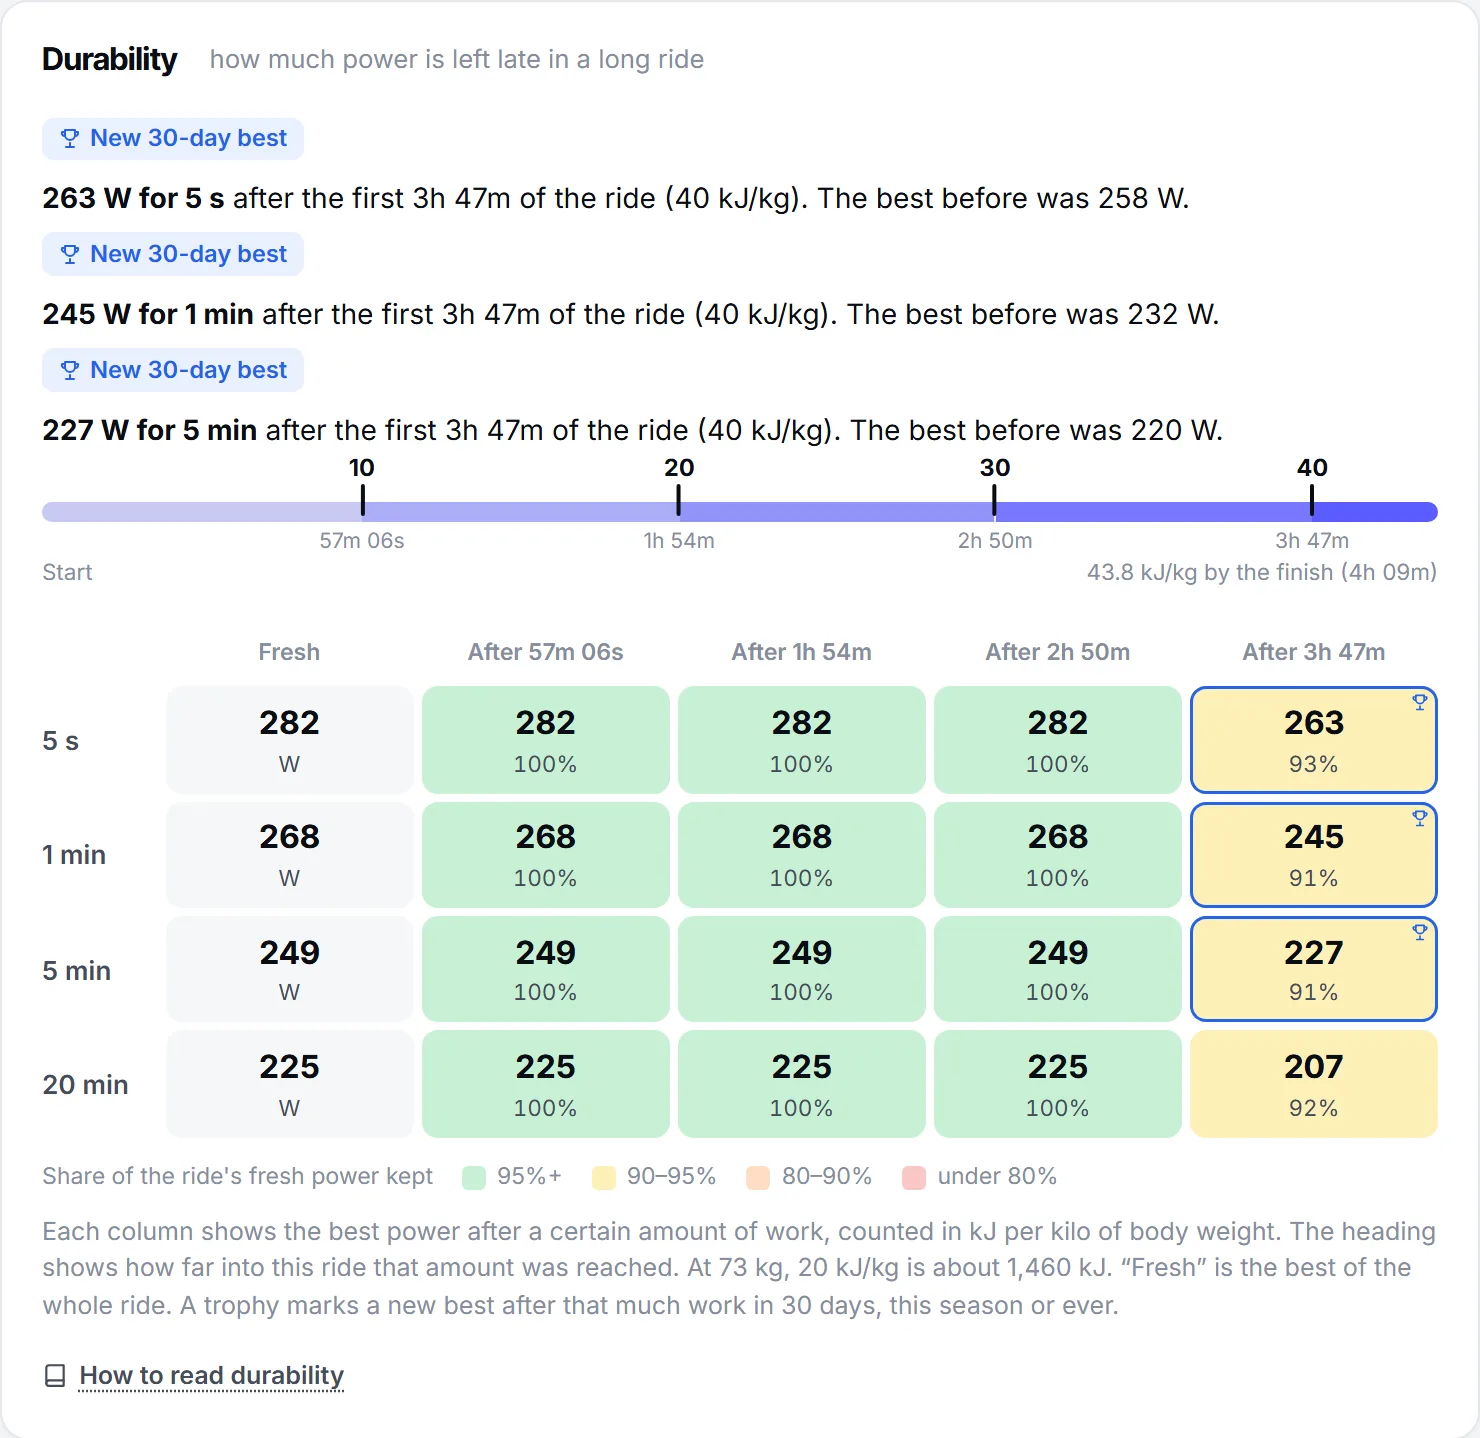
One caution: a low number may mean you never tried hard late in the ride. A ride with no late effort tells you nothing about durability. Treat a gap as untested until a ride or race has asked the question.
A simple durability test
For a cleaner answer, test it on purpose. Pick a five-minute effort on a climb or on the trainer, where conditions repeat.
- Day one: warm up for 20 minutes and ride the five minutes as hard as you can hold evenly. Note the average power.
- Within the next week, after a similar rest day, ride three hours at a steady endurance pace with the fuelling you would use in a race, and write it down. Then ride the same five minutes.
- Divide the second number by the first. If day one gave 330 W and day two gave 307 W, you kept 93%.
There are no agreed norms yet, so read the result as a trend. As a rough guide, 95% or more is hardly any drop, 90 to 95% a small drop, 80 to 90% a clear drop, and under 80% a big one. Keep the pre-load steady: surges change the result, as the Mateo-March study showed. Repeat every six to eight weeks with the same route, fuelling, time of day and kilojoules before the effort.
How do you train durability in cycling?
Train durability with plenty of easy volume, well-fuelled long rides and hard efforts placed late in those rides, and ride the early hours economically. The research is young and mostly links these habits to better durability rather than proving that they cause it.
Coaches combine that evidence with what has worked for their own riders.
- Plenty of easy volume. Spragg, Leo and Swart followed 30 U23 professionals through a season. More time below the first threshold went with better two-minute power when fatigued, and a shift towards polarised training went with better 12-minute power when fatigued. Long, genuinely easy rides are the base; zone 2 training explains how to keep them easy.
- Fuel the long rides. In a laboratory study by Clark and colleagues, two hours of heavy cycling lowered critical power, estimated from a three-minute all-out test, by 9% when participants took a placebo. With 60 g of carbohydrate an hour, it stayed close to its fresh value. W′, the reserve above critical power, fell either way. Practise race fuelling in training; carbohydrate by the numbers covers the arithmetic. A registered sports dietitian can set amounts for you.
- Put hard efforts late. A long ride with the intervals in the last hour trains the exact situation a race creates. Progress by adding work before the efforts, not only by making them harder.
- Ride the early hours economically. Shelter, steady pacing and fewer surges above critical power leave more for the finale.
A six-week progression for a rider with about ten hours a week might look like this:
| Week | Long ride | Late efforts |
|---|---|---|
| 1 | 3 hours steady | 3 × 5 minutes hard in the last 40 minutes |
| 2 | 3 hours steady | 3 × 8 minutes at threshold in the last hour |
| 3 | 3.5 hours steady | 3 × 8 minutes at threshold in the last hour |
| 4 | 2 hours easy, recovery week | none |
| 5 | 3.5 hours with a hilly middle hour | 2 × 12 minutes at threshold in the last hour |
| 6 | 4 hours steady | 5-minute test effort after 3.5 hours |
Check each late interval against the same interval done fresh. When the gap narrows, the training is working.
How do you read durability after a race?
After a long race, look for your best efforts in the final hour and compare them with your fresh bests from the same month. Then look at the first hours: how many surges went above critical power, and how much work was done before the decisive moment.
A rider who fades after a race full of early surges may need better positioning rather than more training. A rider who fades after a calm race may need more long rides with late efforts. Race analysis walks through the whole file.
Durability also explains why selection for long races needs more than FTP. A rider with a modest fresh power curve and strong late numbers can be the better choice for a six-hour classic than a rider who wins every short test.
What mistakes spoil durability testing and training?
Four common mistakes are testing after a different pre-load each time, reading a missing late effort as a weak one, underfuelling long rides and filling long rides with tempo.
- Testing after a different pre-load each time. Kilojoules, surges and fuelling all change the result. Write them down.
- Reading a missing effort as a weak one. No hard effort after three hours means no data, not poor durability.
- Underfuelling long rides. Training durability on an empty tank teaches you to ride slowly, not to finish fast.
- Filling long rides with tempo. Hours of tempo add a lot of fatigue and leave little for the late efforts that train durability. Keep most of the ride easy and make the late efforts count.
Further reading
- The importance of durability in the physiological profiling of endurance athletes, Maunder and colleagues, Sports Medicine, 2021.
- Maintaining power output with accumulating levels of work done is a key determinant for success in professional cycling, van Erp, Sanders and Lamberts, Medicine and Science in Sports and Exercise, 2021.
- Durability in professional cyclists: a field study, Valenzuela and colleagues, International Journal of Sports Physiology and Performance, 2023.
- Dynamics of the power-duration relationship during prolonged endurance exercise and influence of carbohydrate ingestion, Clark and colleagues, Journal of Applied Physiology, 2019.
Velograph is not affiliated with, sponsored by or endorsed by any team, rider or company named in this article. Names are used only to refer to publicly reported work.