What zone 2 means in power, heart rate and lactate, what research on professional riders shows, how much to ride and how to check it in your data.
Zone 2 training is long, steady riding below your first threshold, the point where blood lactate starts to rise. It is easy enough to talk in full sentences and hard enough to feel like proper work after a few hours. In Andrew Coggan's power zones it is 56 to 75% of FTP (functional threshold power). For a rider with an FTP of 250 W, that is about 140 to 188 W. It builds the aerobic base that every harder session sits on. Done well, it is easy riding with a clear purpose; done carelessly, it turns into tempo that tires you without the same benefits.
What is zone 2 in power, heart rate and lactate?
In Coggan's power zones, zone 2 is 56 to 75% of FTP, but each zone system draws it differently. The two heart rate versions do not agree, and the most precise zone 2 is set by blood lactate and lies below the point where lactate first rises above resting levels.
Here is the same rider, with an FTP of 250 W and a threshold heart rate of 165 beats per minute, in each system:
| Measure | Zone 2 | For this rider |
|---|---|---|
| Power, Coggan's levels | 56 to 75% of FTP | 140 to 188 W |
| Heart rate, Coggan's levels | 69 to 83% of threshold heart rate | 114 to 137 bpm |
| Heart rate, Joe Friel's zones | 81 to 89% of threshold heart rate | 134 to 147 bpm |
| Blood lactate | Below the first rise above resting levels, typically under about 2 mmol/L | Needs a step test |
| Breathing | You can talk in full sentences | Check on the road |
The two heart rate versions overlap only at the edge, and Friel's zone 2 starts roughly where Coggan's ends. The lactate version is the most precise. Its upper edge is the first threshold, the highest steady effort before lactate starts to climb, so it describes what is happening in the body rather than a percentage of a test.
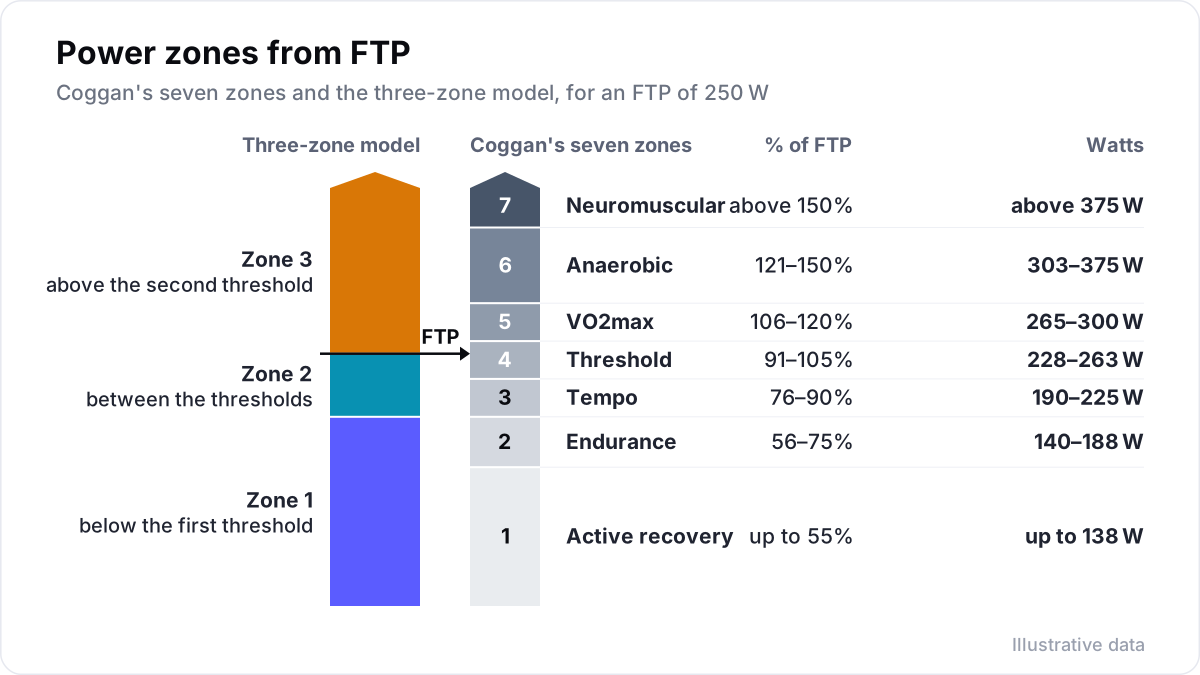
One more trap: in the three-zone model that sports scientists use, zone 2 means the band between the two thresholds, which includes tempo and threshold work. When coaches talk about zone 2 training today, they almost always mean riding below the first threshold. The article on cycling training zones lines the systems up side by side.
What does lactate research say about zone 2?
In a 2018 study, professional cyclists burned the most fat while blood lactate was still low, and fat use fell as lactate rose. That turning point marks the upper edge of a lactate-based zone 2. The study compares groups, so it does not show what zone 2 riding will do for any one rider.
The physiologist Iñigo San-Millán, of the University of Colorado School of Medicine, has studied how fuel use and lactate change with effort, together with George Brooks of the University of California, Berkeley. In a 2018 study in Sports Medicine, they tested 22 male professional road cyclists racing at the top level, 20 moderately active men and 10 men with metabolic syndrome. Each rode a step test with 10-minute stages rising by about 35 W, while the researchers measured blood lactate and how much fat and carbohydrate each rider was burning.
The professionals' numbers show the pattern:
| Power | Fat burned | Blood lactate |
|---|---|---|
| About 205 W | 0.65 g per minute | 0.7 mmol/L |
| About 240 W | 0.67 g per minute | 0.9 mmol/L |
| About 273 W | 0.62 g per minute | 1.3 mmol/L |
| About 307 W | 0.42 g per minute | 2.55 mmol/L |
| About 341 W | 0.17 g per minute | 4.9 mmol/L |
Fat use peaked while lactate was still under 1 mmol/L, then fell as lactate rose. In the professionals and the moderately active men, the first rise in lactate came where fat use started to drop. In all three groups, the two moved in opposite directions. The professionals burned more fat and carried less lactate than the other groups. The authors proposed lactate and fat-use measurements as an indirect way to assess metabolic flexibility: how well the body switches between fat and carbohydrate as fuel.
Two cautions keep this honest. The study compares groups; it does not show what zone 2 riding will do for any one rider. And the professionals also train hard and race. Stephen Seiler's 2010 review of elite endurance athletes found about 80% of sessions at low intensity and the rest hard, not 100% easy. In practice, a lactate-based zone 2 has its upper edge at the point this study describes, where lactate first rises and fat use starts to fall.
How much zone 2 training should you do a week?
As a starting point, ride about 3.5 hours of zone 2 a week if you train 5 to 6 hours, 6.5 hours if you train 8 to 10 and 10 hours if you train 12 to 15. Build each week around the long ride.
Zone 2 pays off through volume and consistency. A ride needs time for the work to add up, and the later hours train the ability to hold power when you are tired. Short zone 2 rides are useful, but the long ride is the backbone.
A practical starting point, depending on your weekly hours:
| Weekly hours | Hours in zone 2 | A typical week |
|---|---|---|
| 5 to 6 | About 3.5 | One ride of 2 to 2.5 hours, one of an hour, one interval session |
| 8 to 10 | About 6.5 | One ride of 3 to 4 hours, two of 1.5 hours, two interval sessions |
| 12 to 15 | About 10 | Two rides of 3 hours, two of 2 hours, two interval sessions |
With few hours, a larger share of hard work can make sense; the article on polarised training covers that debate. Build the long ride by about 15 to 30 minutes at a time, and keep one easier week in every three or four.
How do you find zone 2 without a lab test?
Use power for the ceiling, heart rate for the cost and the talk test as a check. Zone 2 is 56 to 75% of FTP. On the flat, keep the ride between about 65 and 75%, and make sure you can still talk in full sentences.
- Use power for the ceiling. Keep the ride between about 65 and 75% of FTP on the flat. On short climbs, let it rise a little, but not into the high tempo range.
- Use heart rate for the cost. If your heart rate keeps climbing at the same power, the ride is costing more than it should: heat, dehydration, fatigue or the wrong zones.
- Use the talk test. Carl Foster and colleagues have studied the talk test as a marker of training intensity. On the bike, if you can speak in full sentences comfortably, you are in zone 2. If you are down to short phrases, you are above it.
- Use how it feels. Coggan's table rates endurance pace at 2 to 3 on a 10-point scale. It should feel steady and unremarkable for the first hours.
- Test lactate if you can. A step test with a lactate meter, in a lab or with a coach, places your first threshold in watts and beats. It is the most precise anchor.
What are common zone 2 training mistakes?
Common zone 2 mistakes are drifting into tempo, riding too short, coasting too much, running on empty and doing nothing but zone 2. An average of 70% of FTP can hide a third of the ride spent in tempo.
- Drifting into tempo. Group rides, headwinds, short climbs and the urge to finish strong pull a zone 2 ride upwards. An average of 70% of FTP can hide a third of the ride spent in tempo.
- Rides that are too short. Five 45-minute rides a week are not the same as one three-hour ride and two short ones. The long ride trains things the short ones cannot.
- Too much coasting. Long descents and stops lower the average without training much. Count the time you are pedalling in zone 2, not the time on the bike.
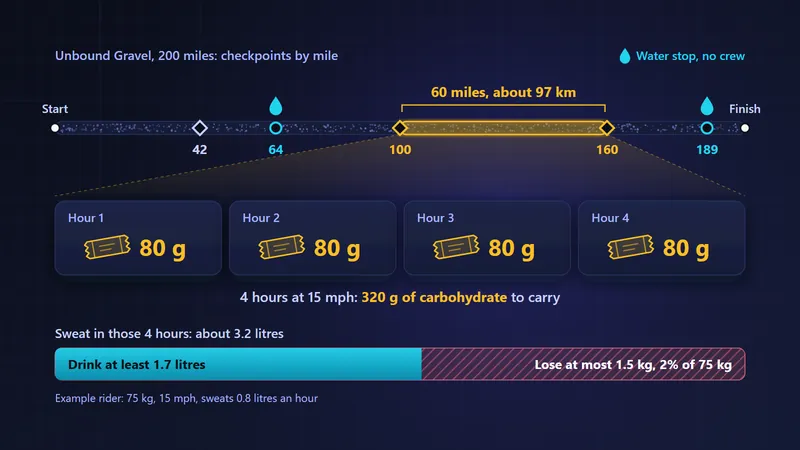
- Running on empty. Long rides need food and drink. What and how much depends on you; a registered sports dietitian can help you plan it.
- Nothing but zone 2. Easy volume builds the base, but threshold and VO2max work still need their own sessions.
How do you check a zone 2 ride in your data?
Check time in zone and heart rate drift after the ride. Most of the pedalling time should be in zone 2, with little above it. If power per heartbeat falls by under 5% from the first half to the second, Joe Friel reads that as good aerobic endurance.
Time in zone. On a three-hour endurance ride, most of the pedalling time should sit in zone 2, with little above it. If a quarter of the ride is in tempo or higher, the ride was harder than planned, whatever the average says.
Heart rate drift. Joe Friel uses aerobic decoupling to judge aerobic endurance. Split a steady ride into two halves and compare power to heart rate in each. Here is a worked example:
| Half | Average power | Average heart rate | Watts per beat |
|---|---|---|---|
| First | 200 W | 138 bpm | 1.44 |
| Second | 200 W | 146 bpm | 1.36 |
The ratio fell from 1.44 to 1.36, which is 5.6%. The averages in the table are rounded to whole numbers; the ratios come from the unrounded ride data.
Friel reads under 5% as good aerobic endurance at that intensity, 5 to 10% as some limitation or fatigue, and over 10% as a sign the ride was above the aerobic threshold or too long for current fitness. He uses steady rides of about two to four hours for this check, depending on the length of the races you train for. Heat and missed bottles raise heart rate too, so compare rides in similar conditions. The article on heart rate vs power explains the causes of drift.
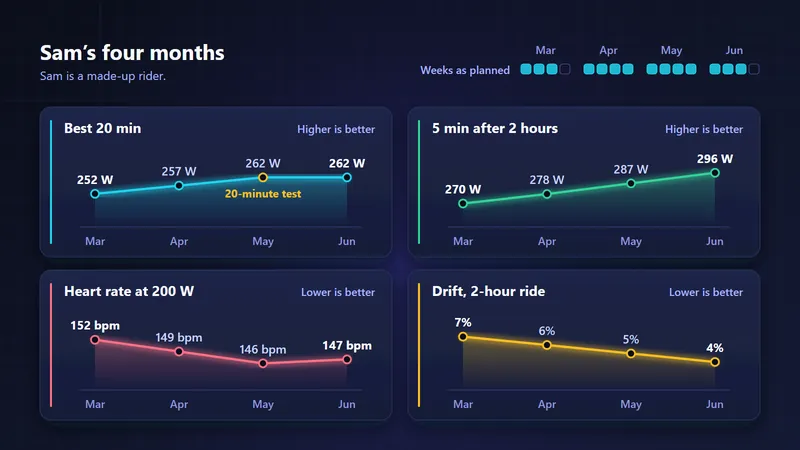
Over weeks, the same zone 2 power should cost fewer beats, and the drift on a long ride should shrink. That is the aerobic base growing. Late in long rides, it also shows up as power that holds up better, which is durability. Velograph shows heart rate drift for every ride with power and heart rate, and for any stretch you select, so a long ride's second half is easy to check.
Further reading
- Assessment of metabolic flexibility by means of measuring blood lactate, fat, and carbohydrate oxidation responses to exercise in professional endurance athletes and less-fit individuals, Sports Medicine, 2018.
- Quantifying training intensity distribution in elite endurance athletes: is there evidence for an optimal distribution?, Scandinavian Journal of Medicine and Science in Sports, 2006.
- What is best practice for training intensity and duration distribution in endurance athletes?, International Journal of Sports Physiology and Performance, 2010.
- Aerobic endurance and decoupling, by Joe Friel, TrainingPeaks, 2008.
- The training intensity distribution among well-trained and elite endurance athletes, Frontiers in Physiology, 2015.
Velograph is not affiliated with, sponsored by or endorsed by any team, rider or company named in this article. Names are used only to refer to publicly reported work.