Coggan's seven power zones, heart rate zones from your threshold heart rate and the three-zone model, with worked numbers and what each zone trains.
Cycling training zones split your effort into bands, each with its own purpose, so that easy days stay easy and hard days are hard enough. Most riders use one of three systems. Andrew Coggan's seven power zones are set as a percentage of FTP, your functional threshold power. Heart rate zones come from your lactate threshold heart rate, as coach Joe Friel teaches. Sports scientists often work with a simpler three-zone model. All three start from one measured anchor, and once you have it, the zones are simple arithmetic.
What are the 7 power zones in cycling?
Andrew Coggan's seven power zones are active recovery, endurance, tempo, lactate threshold, VO2max, anaerobic capacity and neuromuscular power. They run from easy spinning under 55% of FTP up to all-out sprints.
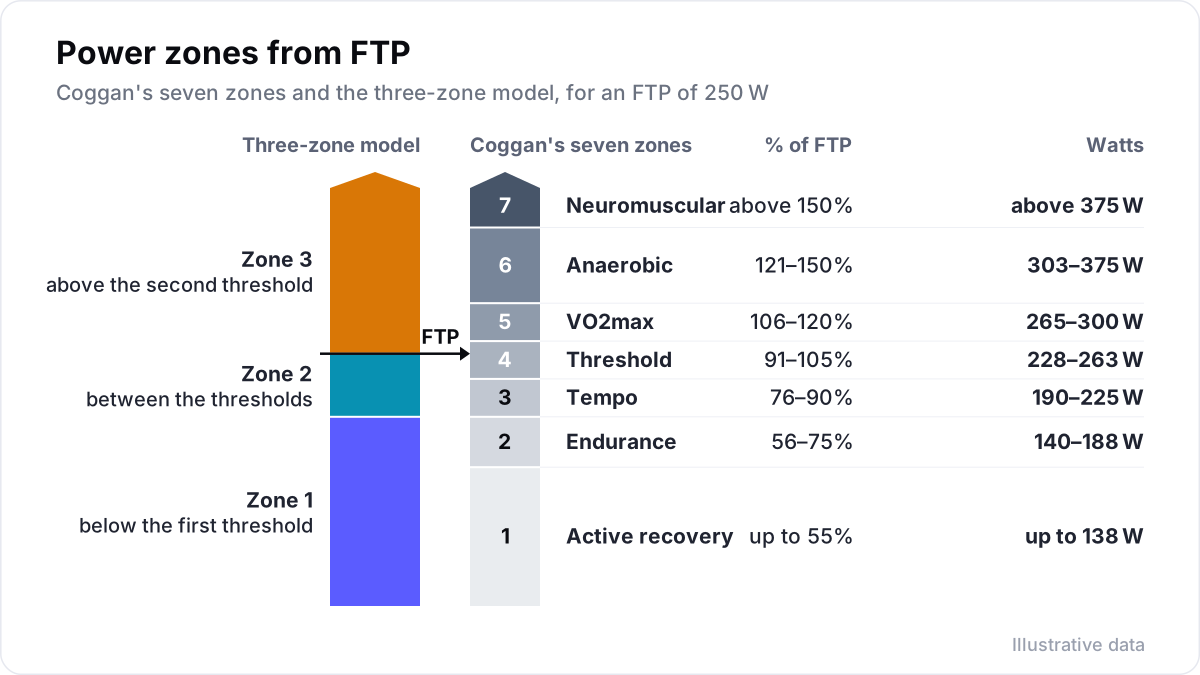
Coggan's zones, often called levels, are set as a percentage of FTP, the highest power you can hold steadily for a long effort. If you do not know your FTP yet, the article on what FTP is explains how to test it. Here are the seven levels, with example watts for an FTP of 250 W:
| Level | Name | % of FTP | At FTP 250 W | What it trains and typical use |
|---|---|---|---|---|
| 1 | Active recovery | under 55% | under 138 W | Recovery rides and easy spinning between efforts |
| 2 | Endurance | 56 to 75% | 140 to 188 W | All-day pace: aerobic base, long rides |
| 3 | Tempo | 76 to 90% | 190 to 225 W | Steady, focused riding; brisk group rides |
| 4 | Lactate threshold | 91 to 105% | 228 to 263 W | Repeats of 10 to 30 minutes near threshold |
| 5 | VO2max | 106 to 120% | 265 to 300 W | Intervals of about 3 to 8 minutes |
| 6 | Anaerobic capacity | 121 to 150% | 303 to 375 W | Hard efforts of 30 seconds to 3 minutes |
| 7 | Neuromuscular power | maximal | maximal | Sprints, jumps and standing starts |
Coggan's own table sets no upper limit for level 6; about 150% of FTP is the usual working ceiling, with sprints above it. Coggan's table also lists heart rate as a share of threshold heart rate for the first five levels: under 68%, 69 to 83%, 84 to 94%, 95 to 105% and over 106%. For levels 6 and 7 heart rate is no use: the efforts are over before it catches up.
Tempo is the zone that is easiest to overdo. A lot of time there leaves you too tired for hard days and not fresh enough for easy ones. Many riders slide into it on rides meant to be endurance, which is why the next section's heart rate check helps.
How do you set heart rate zones for cycling?
Set your heart rate zones from your lactate threshold heart rate (LTHR), the heart rate you can hold in a hard solo effort of about an hour. Joe Friel, author of The Cyclist's Training Bible, sets each zone as a percentage of it.
Friel's test is a 30-minute solo time trial: press the lap button after 10 minutes, and your average heart rate over the last 20 minutes is your LTHR.
Friel's cycling zones, with an example for an LTHR of 165 beats per minute:
| Zone | % of LTHR | At LTHR 165 |
|---|---|---|
| 1 | under 81% | under 134 bpm |
| 2 | 81 to 89% | 134 to 147 bpm |
| 3 | 90 to 93% | 149 to 153 bpm |
| 4 | 94 to 99% | 155 to 163 bpm |
| 5a | 100 to 102% | 165 to 168 bpm |
| 5b | 103 to 106% | 170 to 175 bpm |
| 5c | over 106% | over 175 bpm |
Threshold heart rate is a better anchor than a maximum heart rate from a formula such as 220 minus your age, which can be well off for any one person. Heart rate zones are at their most useful on long, steady rides. In short intervals, heart rate lags behind the effort by a minute or more, and in heat or with fatigue it drifts upwards at the same power. The article on heart rate vs power explains when each is the better guide.
What is the three-zone training model?
The three-zone model splits your effort into three bands at two physiological turning points, the first and second thresholds. Sports scientists use it often, and they measure both thresholds in a lab or with a careful field test.
The first threshold is where blood lactate first rises above resting levels, typically below about 2 millimoles per litre, and breathing deepens. The second threshold is the highest intensity at which lactate can still settle, typically around 4 millimoles per litre.
- Zone 1: below the first threshold. Easy, sustainable, conversational.
- Zone 2: between the two thresholds. Comfortably hard to hard.
- Zone 3: above the second threshold. Hard to very hard, and not sustainable for long.
Stephen Seiler used this model in his studies of elite endurance athletes. With Glenn Øvrevik Kjerland, he logged 384 sessions by eleven junior cross-country skiers over 32 days. Most of their training sat in zone 1, a small share between the thresholds and 15 to 20% above the second. His 2010 review found the same pattern across sports: about 80% of sessions at low intensity. The article on polarised training covers what that means for a rider with less time.
Can you convert power zones to heart rate zones?
You can convert power zones to heart rate zones only roughly, because the two systems and the three-zone model line up only approximately. The three systems describe the same body, so they overlap. There is no fixed conversion, because the first threshold sits at a different share of FTP for every rider and moves with training.
As a rough guide, they line up like this:
| Three-zone model | Coggan power levels | Friel heart rate zones | How it feels |
|---|---|---|---|
| Zone 1, below the first threshold | 1, 2 and sometimes the lower part of 3 | 1 and 2 | You can talk in full sentences |
| Zone 2, between the thresholds | 3 and 4 | 3 and 4 | Short phrases only |
| Zone 3, above the second threshold | 5, 6 and 7 | 5a, 5b and 5c | A few words at most |
The second threshold sits close to FTP for most riders. The first is the one that varies, and a lab test or a lactate test is the only way to place it with confidence.
Watch the name "zone 2". In Coggan's system it means endurance, 56 to 75% of FTP. In Friel's it is 81 to 89% of threshold heart rate. In the three-zone model it means the band between the thresholds, which includes tempo and threshold work. When someone recommends zone 2 training, they almost always mean steady riding below the first threshold.
How do I calculate my cycling training zones?
Measure your FTP and your threshold heart rate, then multiply each of them by the zone percentages. You do not need an app to set your zones. You need two numbers and a few minutes.
- Measure your anchors. Test FTP with a 20-minute or ramp test, and LTHR with a 30-minute solo effort. One 30-minute test can give both: its average power is a good FTP estimate.
- Multiply. Take each percentage boundary from the tables above and multiply it by your FTP or LTHR.
- Round and write it down. Round power to the nearest 5 W and heart rate to the nearest beat or two. Put the zones on your head unit and your training calendar.
- Recalculate after every new test. Zones set from an FTP that is 5% too high make every session 5% harder than planned.
A worked example for a rider with an FTP of 280 W: endurance is about 155 to 210 W, threshold about 255 to 295 W and VO2max about 295 to 335 W. If the same rider has a lower FTP indoors, keep a separate set of indoor zones rather than forcing outdoor numbers on the trainer. In Velograph, power zones follow Coggan's seven levels and heart rate zones follow the rider's threshold heart rate. Both update when the threshold changes.
How exact are cycling training zones?
Cycling training zones are guides with blurry edges, not exact limits. Your body has no switch at 75% of FTP. Riding at 74% and at 77% trains much the same things. Zones are a shared language for planning and reviewing, not a set of walls.
Keep these points in mind when you use them:
- Fatigue moves the edges. After hours of riding, the power you can produce for the same effort falls. The article on durability shows by how much.
- Heat, sleep and stress move heart rate. On a hot day, the same power gives a higher heart rate. Let power set the effort and heart rate tell you the cost.
- Different bikes, different numbers. Riders often hold less power on a time-trial bike or indoors. Separate zones avoid wrong targets.
- How it feels still counts. Rate each session from 1 to 10. If zone 2 feels like a 6 out of 10, something is off: the zones, the day or the rider.
Further reading
- Power training levels, by Andrew Coggan, TrainingPeaks, 2016.
- Joe Friel's quick guide to setting zones, TrainingPeaks, 2012.
- What is best practice for training intensity and duration distribution in endurance athletes?, International Journal of Sports Physiology and Performance, 2010.
- The training intensity distribution among well-trained and elite endurance athletes, Frontiers in Physiology, 2015.
Velograph is not affiliated with, sponsored by or endorsed by any team, rider or company named in this article. Names are used only to refer to publicly reported work.