A race file holds the story of the race in numbers. How to find the moments that decided it, count surges, check durability and turn it into actions.
Race analysis means using the file to understand the race, not only your numbers. Start from the story: where the race split, where you were and how it felt. Then look at the moments that decided it: your best efforts and when they came, the surges above critical power, the time spent hard in each phase and what was left in the final hour. Finish with two or three actions for the next race. The average power of a four-hour race tells you very little; the ten minutes that decided it tell you most of what you need.
How do you start a race analysis?
Start a race analysis from the story of the race, not from the file. If you open the file first, the biggest numbers draw your eye, and they are not always the moments that mattered.
Before you open the file, write five to eight lines from memory. Where did the race split? Where were you when it happened? What did you feel, and what did you decide? Note the kilometre or time of each key moment: the crosswind section, the foot of the climb, the break forming, a crash, the last 10 km.
This order matters. A 1,100 W spike at kilometre 20 may have been a needless jump; a steady 330 W for four minutes at kilometre 140 may have been the effort that kept you in the front group.
The story also tells you how to read low numbers. Low power in the final can mean you were dropped. It can also mean you were sheltered in the right wheel, exactly as planned. The file cannot tell the difference; you can.
How do you read best efforts in a race file?
Find your best efforts at a few durations, note when each happened and how much work came before it, and compare each with your fresh best from recent weeks. Work done is counted in kilojoules; dividing by body weight (kJ per kilo) makes riders and races comparable.
Here is an example for a made-up 70 kg rider in a four-hour race averaging 220 W:
| Duration | Race best | When | Work done before | Share of fresh best |
|---|---|---|---|---|
| 10 seconds | 1,050 W | 3:58, sprint for sixth place | 45 kJ/kg | 93% |
| 1 minute | 560 W | 1:12, break forming | 14 kJ/kg | 97% |
| 5 minutes | 365 W | 3:31, last climb | 40 kJ/kg | 89% |
| 20 minutes | 305 W | 2:05, chase in the crosswind | 24 kJ/kg | 95% |
The table already says more than any average. The rider was close to fresh power early, and lost the most on the last climb, at five minutes, after 40 kJ per kilo. That points to the final climb as the place to look, and to durability as a possible limiter.
Compare races with races of the same kind. In a 2021 review of professional men's racing, Sanders and van Erp found that stage type shapes the demands. Stages with more climbing brought higher intensity and load, and the highest power over efforts longer than ten minutes. Flat and semi-mountainous stages brought the highest power over short efforts, under two minutes. One-day races tended to bring higher intensity and load than stages of a stage race. A flat criterium and a hilly road race will never produce the same power curve, and they should not be judged against each other.
What is a surge in a cycling race?
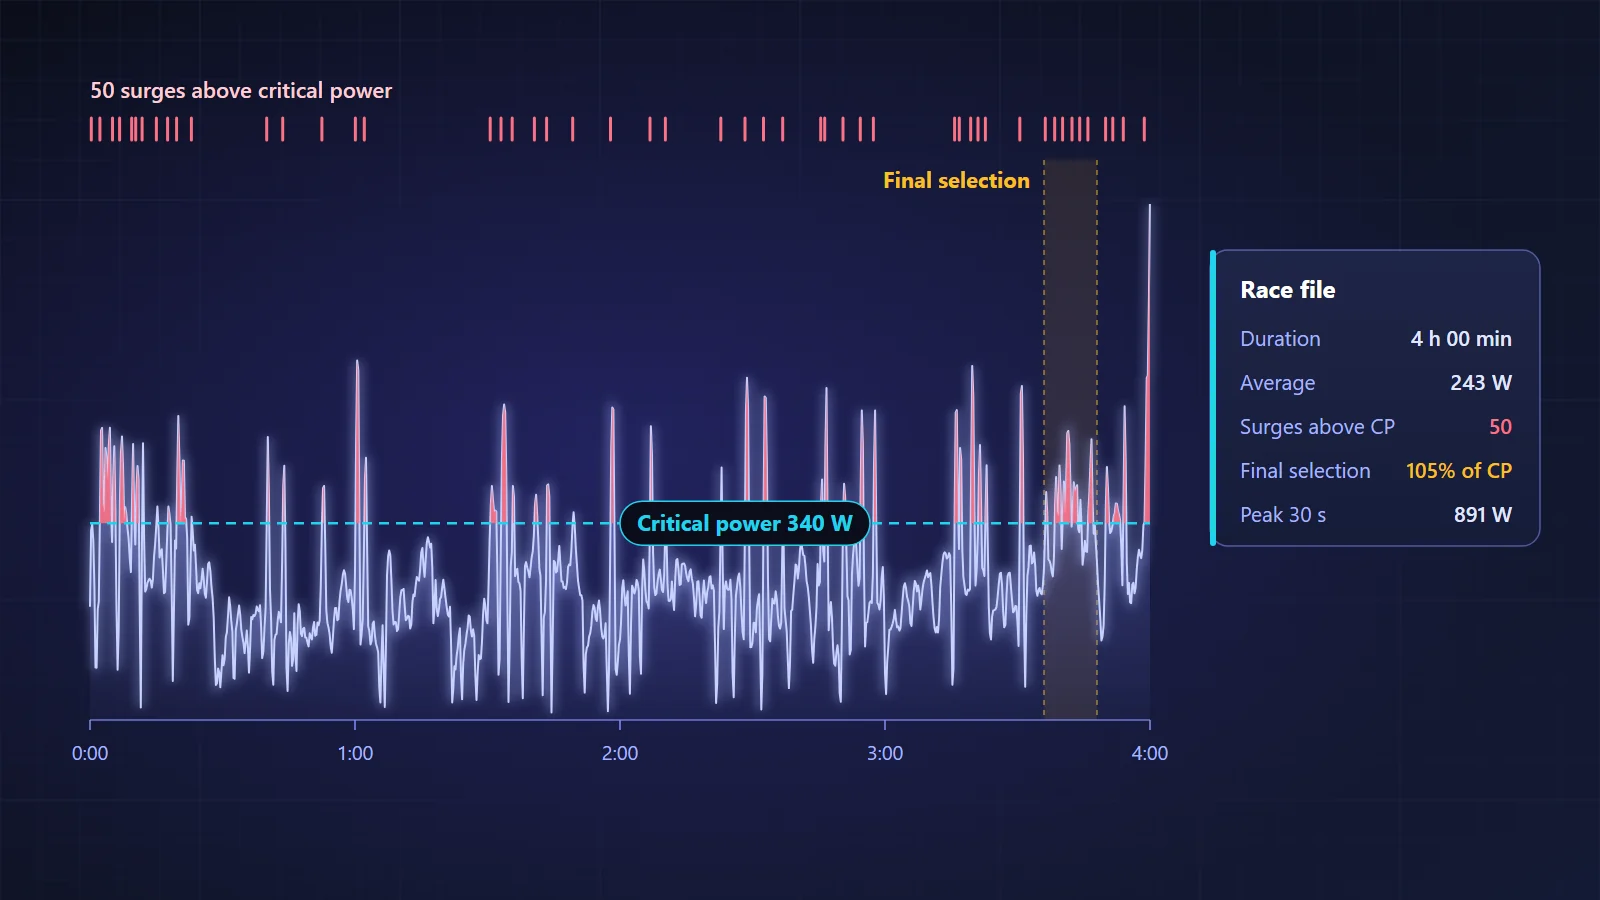
A surge is a spell above your critical power (CP), the boundary above which you draw on a limited reserve called W′. Each surge spends part of that reserve, and below CP it refills only slowly. Critical power and W′ explains the model. In a race file, the surges show where the race cost you.
For each race, count three things: how many surges there were, how much work you did above CP in total, and how low W′ went. Then sort the surges into those that were needed and those that were not. Closing a gap at the foot of a climb is needed. Moving up on the outside five times in the first hour because you started at the back is not.
Breakaways have a typical shape in the file. Abbiss and colleagues (2013) studied power data from professional races. In the 5 to 10 minutes before a break formed, they found many short surges, about 5 to 15 seconds long and around 9.5 to 14 W/kg. After that, power dropped but stayed high, around 450 to 500 W, for 30 seconds to 5 minutes, depending on how the bunch chased. A cluster of spikes followed by a long hard block usually marks a break going clear.
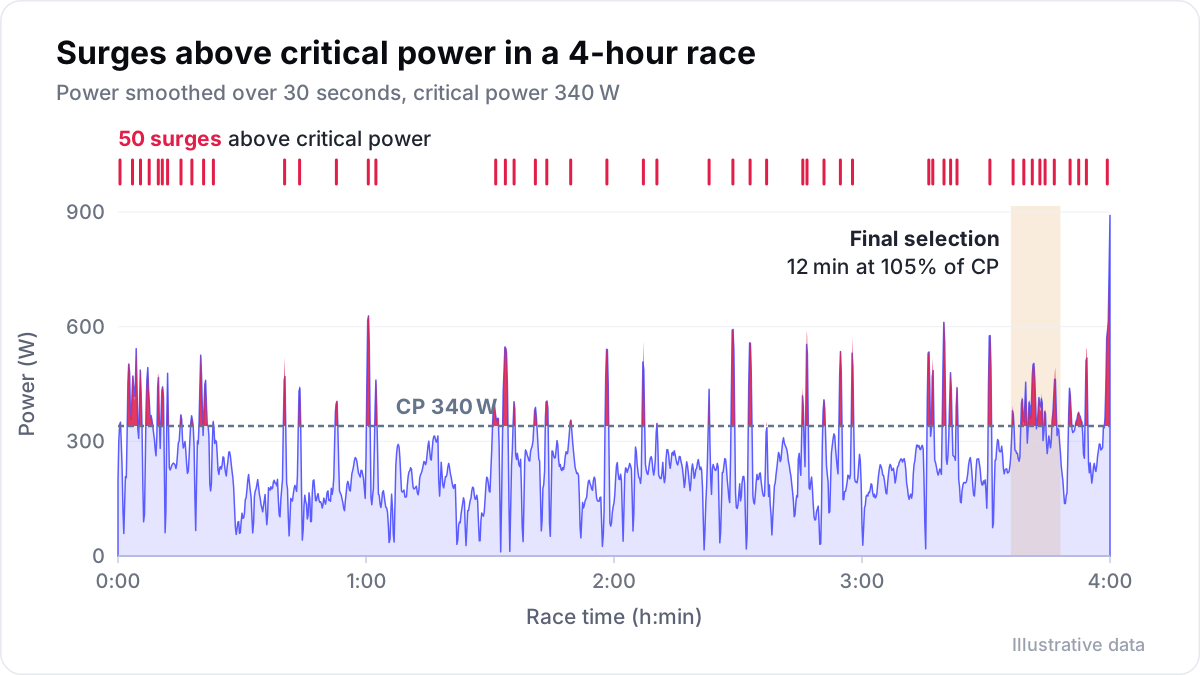
Velograph counts every surge above critical power that costs at least a kilojoule of W′, and shows the total work above CP and how low W′ fell. Those three numbers make races easy to compare across a season.
How should you look at time in zones in a race?
Split the race into phases, because time in zones for the whole race hides the pattern. Use the start until the break goes, the middle and the final hour, and note average power, time above threshold and the number of surges for each.
Continuing the example:
| Phase | Length | Average power | Time above threshold | Surges above CP |
|---|---|---|---|---|
| Start to the break (0:00 to 1:15) | 75 min | 245 W | 14 min | 31 |
| Middle (1:15 to 3:00) | 105 min | 195 W | 6 min | 12 |
| Final hour (3:00 to 4:00) | 60 min | 235 W | 11 min | 19 |
Half of this rider's surges came before the break formed, and 14 minutes above threshold in the first 75 minutes is a lot. If the story says the rider was fighting for position rather than attacking, the lesson is about positioning, not fitness.
Use heart rate with care. It lags behind short efforts and drifts upward over hours, more so in heat, so it understates the surges and overstates the late effort.
How do you check durability in a race file?
Compare your best 1- and 5-minute power in the final hour with your fresh bests, and note how much work came before them in kJ per kilo. Durability is how much of your power is still there late in a long race.
Many road races are decided in the final hour, after hours of work. Maunder and colleagues (2021) argued that fresh test numbers do not capture this. Van Erp, Sanders and Lamberts (2021) found that more successful professionals lost less power after heavy prior work: climbers at 5 and 20 minutes, sprinters at 10 seconds and 1 minute. The full picture is in durability in cycling.
Read each late effort with the story of the race:
| What the file shows | Likely reading | Next step |
|---|---|---|
| Low late power after many early surges | The race was ridden expensively | Positioning and economy in the first hours |
| Low late power after a calm race | Endurance or fuelling was short | Long rides with late efforts; check carbohydrate taken |
| Good late power, no result | Tactics or timing | Review the final with the team |
| No hard effort late at all | Untested, not weak | Look at where you were when it split |
Fuelling belongs in this check. If the plan said 80 g of carbohydrate an hour and the rider took 40, the late numbers may say more about the bottles than about fitness.
Compare with the plan and the course
Put the file next to the race plan. Did each rider do the job the plan gave them? Did the key moments happen where the plan expected them, and were you in position for each one? Where the race went differently, the question is whether the plan was wrong or the execution.
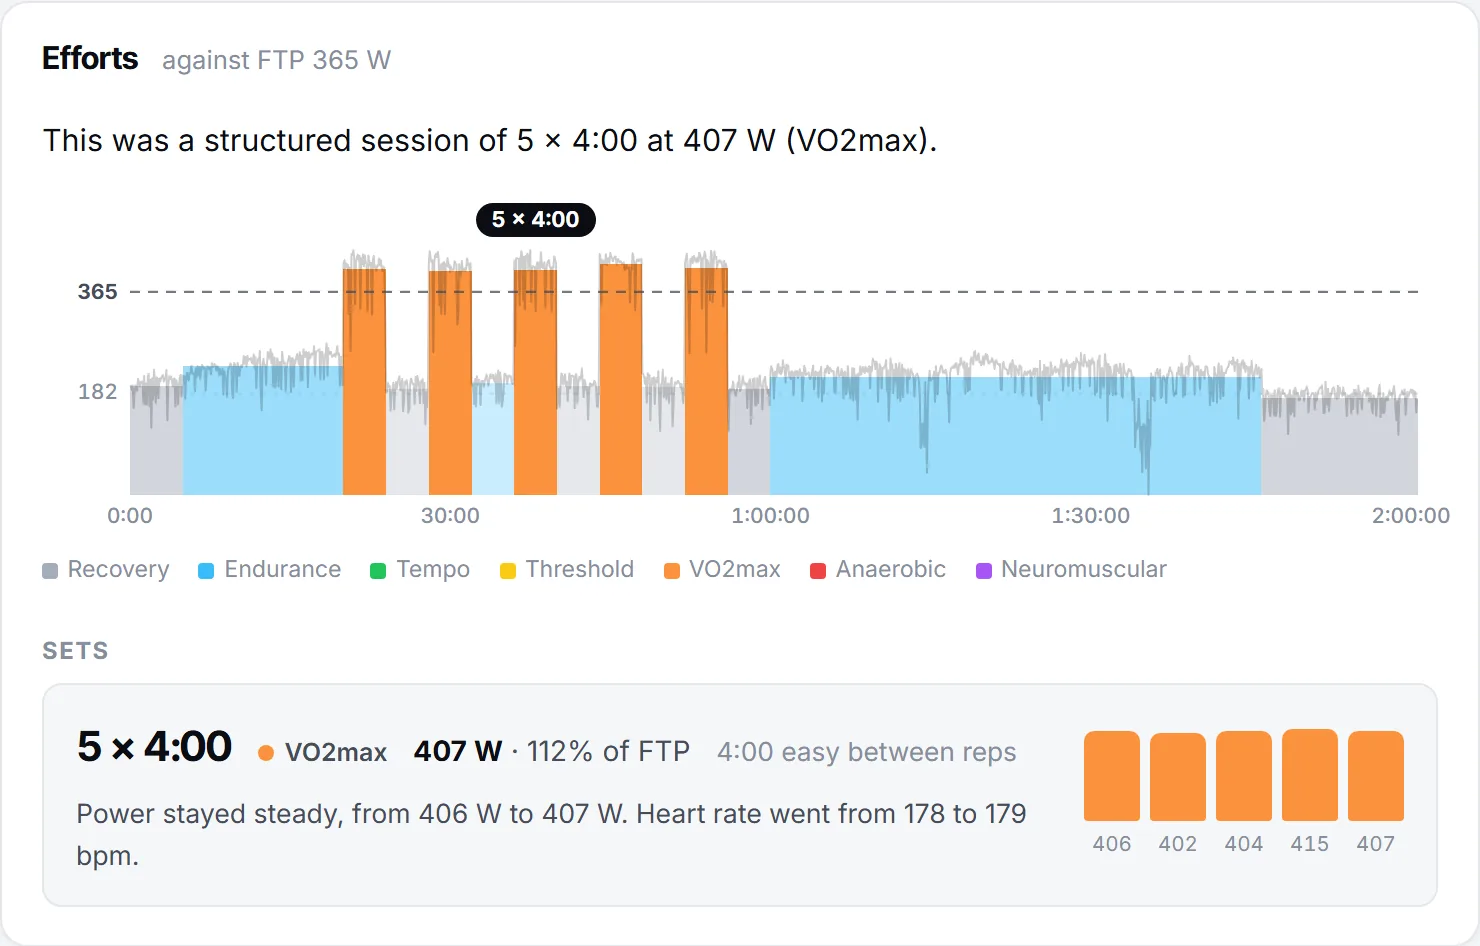
Read the course alongside the power. A climb ridden at 5% above plan in the first half and 10% below in the second is a pacing issue, the same one time triallists face; time trial pacing covers it. Wind direction on exposed sections explains a lot of early surges. For a team, put riders side by side on the same climbs in W/kg, and note who was sheltered where.
How do you turn a race analysis into actions?
Turn a race analysis into two or three specific actions, each tied to a number you can check at the next race. Sort them into what to keep, what to change and what to train.
An analysis that ends without a decision is a hobby. For the example rider, the actions could look like this:
- Keep: "Started the last climb in the first ten wheels. Do the same next race."
- Change: "14 minutes above threshold in the first 75 minutes, mostly moving up. Start the race in the front third and aim for under 8 minutes."
- Train: "Five-minute power on the last climb was 89% of fresh after 40 kJ per kilo. Add late efforts to two long rides a week for six weeks, then compare."
Bring these to the race debrief, where the rider's view and the coach's view meet, and store them with the race. Next year's edition will ask the same questions, and the answers will be waiting.
Further reading
- The physical demands and power profile of professional men's cycling races: an updated review, Sanders and van Erp, International Journal of Sports Physiology and Performance, 2021.
- Distribution of power output when establishing a breakaway in cycling, Abbiss and colleagues, International Journal of Sports Physiology and Performance, 2013.
- Maintaining power output with accumulating levels of work done is a key determinant for success in professional cycling, van Erp, Sanders and Lamberts, Medicine and Science in Sports and Exercise, 2021.
- The importance of durability in the physiological profiling of endurance athletes, Maunder and colleagues, Sports Medicine, 2021.