Critical power is the line between sustainable and unsustainable effort; W′ is the reserve above it. How to estimate both and use them to train and race.
Critical power (CP) is the highest power you can sustain without steadily using up a limited reserve. W′, pronounced "W prime", is the size of that reserve, measured in kilojoules. Ride above critical power and W′ drains; ride below it and W′ refills. Together, the two numbers tell you how long you can hold any effort above threshold, how hard an attack you can afford and how much you need to save for the finish.
What is critical power in cycling?
Critical power is the boundary between steady efforts, where oxygen uptake and blood lactate settle, and harder ones where they keep rising until you stop. The idea comes from a 1965 study by Monod and Scherrer, and critical power is close to the maximal lactate steady state.
In 1965, the physiologists Monod and Scherrer published a study of how much work a group of muscles can do before exhaustion. They found that total work rose in a straight line with the time to exhaustion. The slope of that line was a power they called critical power, which they described as a power that could be kept up for a very long time without fatigue. In 1981, Moritani and colleagues applied the same model to cycling on an ergometer.
Later researchers named the reserve W′. You will also see it called anaerobic work capacity, although reviews warn that the two terms are not exactly interchangeable. Today, critical power is understood as a boundary between two intensity domains. Below it, oxygen uptake and blood lactate settle to steady values. Above it, they keep rising until you have to stop. Andrew Jones and Anni Vanhatalo describe critical power as close to the maximal lactate steady state, the highest intensity at which lactate can still settle.
How long can you ride above critical power?
You can ride above critical power until W′ runs out, and that takes W′ divided by how many watts above critical power you ride. With a W′ of 20 kJ, 20 W over lasts more than a quarter of an hour, and 200 W over lasts less than two minutes.
The model fits in one line: the power you can hold for a given time equals critical power plus W′ divided by that time. Turn it around and you get the time until W′ is empty at any power above CP: W′ divided by how far above CP you ride.
For a rider with a critical power of 280 W and a W′ of 20 kJ (20,000 joules):
| Power | Above CP | Time until W′ is empty |
|---|---|---|
| 300 W | 20 W | 16 min 40 s |
| 330 W | 50 W | 6 min 40 s |
| 380 W | 100 W | 3 min 20 s |
| 480 W | 200 W | 1 min 40 s |
| 680 W | 400 W | 50 s |
The table shows how quickly the cost rises with intensity. At 20 W over critical power, the reserve lasts over a quarter of an hour. At 200 W over, it lasts less than two minutes. The model fits most closely for efforts of about 2 to 15 minutes. It overestimates what you can hold for very short and very long efforts, so read the first and last rows as rough guides.
What is W′ balance?
W′ balance is a second-by-second count of how much of the W′ reserve is left during a ride. It drains joule for joule above critical power and refills along a curve below it, faster the further below critical power you ride.
A race is never one steady effort, so the next step is to track W′ second by second. In 2012, Philip Skiba, Weerapong Chidnok, Anni Vanhatalo and Andrew Jones published a model of W′ balance. Above critical power, W′ drains joule for joule. Below it, W′ refills along a curve: quickly at first, then more slowly, and faster the further below critical power you ride. In their study, the model predicted when a competitive cyclist ran out of W′ during a road race. Skiba and colleagues published an updated version in 2015.
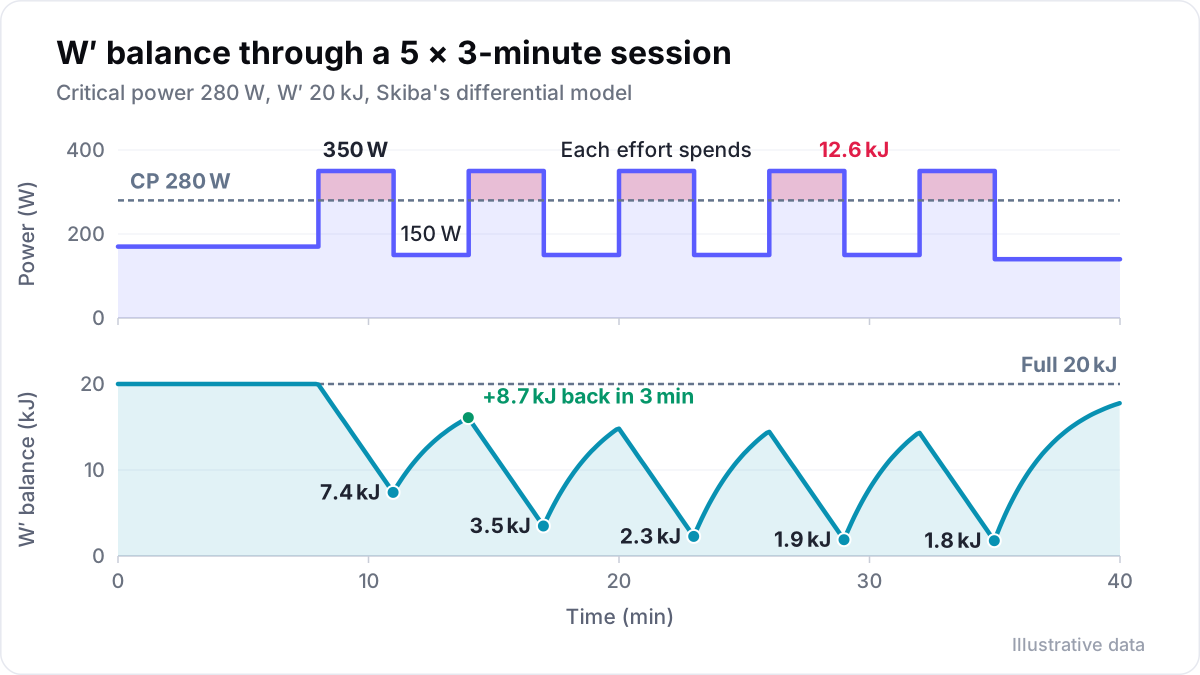
Golden Cheetah, the free open-source analysis software, was an early home for the model. Its version 3.1 added W′ balance charts and metrics, so any rider with a power meter could see the line under their own power trace.
Two cautions come with it. First, recovery differs a lot between riders. Jones and Vanhatalo describe W′ recovery as curved and highly variable from person to person, so a generic recovery curve is a starting point. Second, a W′ balance that falls well below zero means the inputs are wrong: your critical power or W′ is set too low.
How do you calculate critical power and W′?
Ride at least three all-out efforts of different lengths, ideally between 2 and 15 minutes, and plot the work done against time. The slope of the straight line through them is critical power, and the point where it meets zero time is W′.
You need at least three all-out efforts of different lengths. A review of power profiling by Peter Leo and colleagues recommends efforts between 2 and 15 minutes, with at least 30 minutes of rest between them on the same day, or 24 hours apart. Two efforts always fit a perfect straight line, so they cannot tell you how good the estimate is. A third, or a fourth, can.
Your power curve can stand in for a test if the efforts were truly all-out. Here is a worked example from a rider's highest powers over the last 90 days:
| Duration | Highest average power | Work done |
|---|---|---|
| 3 minutes (180 s) | 400 W | 72.0 kJ |
| 7 minutes (420 s) | 331 W | 139.0 kJ |
| 12 minutes (720 s) | 310 W | 223.2 kJ |
Plot work against time and the points sit on a straight line. The slope is critical power: (223.2 − 72.0) kJ ÷ (720 − 180) s = 0.280 kJ per second, or 280 W. W′ is where that line meets zero time: 72.0 kJ − 280 W × 180 s = 21.6 kJ. The 7-minute effort checks the result: 280 W + 21,600 J ÷ 420 s = 331 W, as ridden.
Sanity-check the answer. The laboratory studies reviewed by Jones and Vanhatalo report W′ values of roughly 16 to 23 kJ. A result far outside that range usually means one effort was not all-out. A soft 3-minute effort makes W′ too small and critical power too high; a stale 12-minute effort does the opposite. Critical power usually lands a little above FTP; the article on what FTP is compares the two.
A single 3-minute all-out test also exists. Anni Vanhatalo and colleagues showed in 2007 that the power at the end of it matched critical power in a group of ten active people. The review by Leo and colleagues advises against relying on it and recommends several separate efforts instead.
How do you use critical power in training and racing?
Use critical power and W′ to work out how much of the reserve each effort costs. That lets you set intervals, time attacks, save for the sprint and pace a time trial.
Take the rider above, with a critical power of 280 W and a W′ of 21.6 kJ.
- Intervals. Five 3-minute efforts at 360 W each use 80 W × 180 s = 14.4 kJ, two thirds of W′. Depending on the model and the rider, three easy minutes give back roughly a third to two thirds of it. Each rep starts a little emptier, so the last ones are the hardest. To keep reps repeatable, shorten them, lengthen the rests or lower the power.
- Attacks. A 30-second attack at 600 W uses 320 W × 30 s = 9.6 kJ, nearly half the reserve. Two attacks close together leave little for a third. Sitting in the wheel below critical power afterwards is what refills it.
- Sprint finish. A 15-second sprint at 1,000 W uses 720 W × 15 s = 10.8 kJ. Arrive at the last kilometre with W′ as full as you can: shelter, and stay below critical power wherever the race allows.
- Time trial. For a 40-minute effort, the model allows about 280 + 21,600 ÷ 2,400 = 289 W. Starting at 330 W for three minutes uses 50 W × 180 s = 9.0 kJ of W′, where even pacing would have used 1.6 kJ. The extra 7.4 kJ is a third of the whole budget, gone in the first three minutes. The article on time trial pacing shows how to avoid that.
After the race, look at where W′ balance dipped lowest and what it cost you. The article on race analysis shows how to read surges above critical power in a race file.
How accurate is the critical power model?
The critical power model is a simplification that fits best for all-out efforts of about 2 to 15 minutes. Its numbers fall with fatigue, change with training and are only as good as the efforts they come from.
Keep these limits in mind:
- They move with fatigue. After hours of riding, the whole power-duration curve sits lower. A critical power set fresh overstates what you have in the finale of a long race.
- They move with training. Jones and Vanhatalo note that endurance training consistently raises critical power and tends to lower W′. Re-estimate after each block.
- Recovery is personal. Two riders with the same numbers can recover at different rates between efforts.
- The estimate is only as good as the efforts. An effort that was not all-out pulls the line in the wrong direction.
Read the numbers alongside your power curve, not instead of it. In Velograph, critical power and W′ are fitted from a rider's hardest efforts between 3 and 20 minutes. W′ balance is drawn on each ride, and surges above critical power are counted, with a note when the numbers are estimates rather than tested.
Further reading
- The 'critical power' concept: applications to sports performance with a focus on intermittent high-intensity exercise, Sports Medicine, 2017.
- Modeling the expenditure and reconstitution of work capacity above critical power, Medicine and Science in Sports and Exercise, 2012.
- Power profiling and the power-duration relationship in cycling: a narrative review, European Journal of Applied Physiology, 2022.
- Golden Cheetah, open-source cycling and triathlon power analysis, Golden Cheetah project.
Velograph is not affiliated with, sponsored by or endorsed by any team, rider or company named in this article. Names are used only to refer to publicly reported work.