How a cycling power curve is built from your hardest efforts, what its shape says about your strengths, and how to tell a real weakness from an untested one.
A power curve is a line through the highest average power you have held for every duration, from a one-second kick to a four-hour ride. Read from left to right, it shows what you can do in a sprint, an attack, a climb and a long day. Its shape says what kind of rider you are. Compared over time, it shows whether your training is working and where a few focused weeks would pay off most.
How is a power curve calculated?
A power curve is built from your highest average power at every duration, taken from all your rides in a period. That highest average is called mean maximal power, or MMP.
A power meter usually records one reading per second. For each duration, analysis software slides a window along the ride and keeps the highest average it finds: the hardest 5 seconds, the hardest minute, the hardest 20 minutes. Repeat it for every duration and every ride in a period, keep the highest value at each point, and you have the curve.
One ride gives a partial curve. A sprint for a town sign fills the left end, a long climb fills the middle and a steady four-hour day fills the right. Over weeks, those efforts add up to one line that describes the rider rather than the day. Sports scientists call this the record power profile, and they use it to compare riders from field data.
Here is an example for a 72 kg amateur road rider over the last 90 days:
| Duration | Highest average power | W/kg | What it mostly reflects |
|---|---|---|---|
| 5 seconds | 1,050 W | 14.6 | Sprint: neuromuscular power |
| 1 minute | 540 W | 7.5 | Attacks and short climbs: anaerobic capacity |
| 5 minutes | 345 W | 4.8 | The aerobic ceiling: VO2max power |
| 20 minutes | 290 W | 4.0 | Threshold: long climbs |
| 60 minutes | 265 W | 3.7 | Threshold held for a full hour |
| 4 hours | 205 W | 2.8 | Endurance and fatigue resistance |
W/kg is power divided by body weight. It largely decides how fast you climb, as the article on watts per kilo explains. The curve always falls from left to right, because nobody holds sprint power for an hour. What matters is how steeply it falls, and where. The time axis is usually logarithmic, so the first minute gets more room than the last three hours.
What type of rider does your power curve show?
Your power curve's shape shows whether you are a sprinter, puncheur, climber, time triallist or rouleur. The shape tells you more than any single number, because it shows each ability against the rest of the same rider's engine.
Two riders with the same FTP (functional threshold power, roughly the highest power you can hold for an hour) can have very different curves.
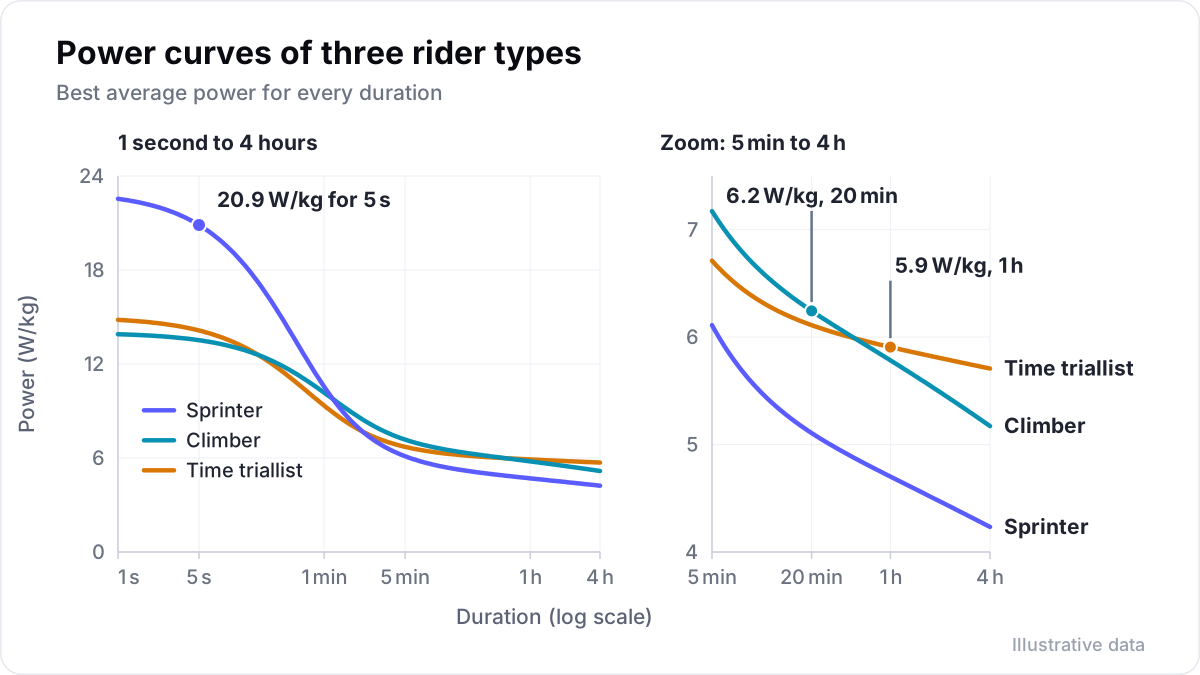
Coaches recognise five common shapes:
- Sprinter. The left end stands far above the rest: 5 to 15 seconds is exceptional, and the curve falls steeply after a minute.
- Puncheur. Strong from about 30 seconds to 3 minutes, the efforts that decide short, steep climbs and late attacks.
- Climber. Not always high in absolute watts, but high in W/kg from about 5 to 40 minutes.
- Time triallist. High absolute watts and a flat right-hand side: little loss from 20 minutes to an hour.
- Rouleur. High absolute power over long durations and little fade after hours of riding, with less punch.
Large datasets show the same picture. Pedro Valenzuela and colleagues analysed 129,262 files from 144 professional riders on four teams over eight years. Sprinters had the highest power from 5 to 30 seconds, in watts and in W/kg. General classification riders, the ones racing for the overall win in stage races, had the highest W/kg from 1 minute to 4 hours.
What is Coggan's power profile?
Andrew Coggan's power profile is a widely used public reference for comparing your W/kg at four durations, published with Hunter Allen in Training and Racing with a Power Meter and on the TrainingPeaks blog. It uses four index durations: 5 seconds, 1 minute, 5 minutes and FTP.
These durations stand in for neuromuscular power, anaerobic capacity, VO2max and threshold. Each duration has a column of W/kg values, anchored at the top on world champions and at the bottom on untrained people. You mark your four values and join them. Coggan names four profiles: the sprinter, the pursuiter (strongest from about 1 to 5 minutes), the time triallist and the all-rounder. He notes that most non-elite riders are all-rounders, with all four values in similar places.
Read it with Coggan's own caveats in mind:
- The 1-minute value is a proxy, not a pure measure. About 40 to 45% of the energy in a one-minute effort comes from aerobic sources.
- The tables are based on young adults and do not adjust for age or development.
- Every value must come from a genuine all-out effort, or the profile is distorted.
Use the tables to see your shape, not to grade yourself. Your own history is the comparison that counts.
What is a power-duration model?
A power-duration model estimates what your physiology probably allows, while the raw power curve shows only what you have ridden. The simplest is the critical power model, fitted to your efforts between a few minutes and about 20 minutes.
The critical power model gives two numbers: critical power, the highest power you can sustain without draining a limited reserve, and W′, the size of that reserve. The article on critical power and W′ explains both in detail.
WKO, TrainingPeaks' analysis software, is a good example of deep modelling done well. Its power-duration model fits the whole curve and returns Pmax (the highest power over a full pedal revolution), FRC (the work you can do above threshold), a modelled FTP and time to exhaustion. Time to exhaustion is how long you can hold that FTP, usually between 30 and 70 minutes. The model separates what you rode from what you could ride.
Field data stands up well when the efforts were real. In a 2010 study, Quod and colleagues compared a laboratory power profile test with the same ten riders' race data. For efforts from 1 to 10 minutes, the race values and the lab values did not differ.
Is a dip in your power curve a weakness?
A dip in your power curve can be a real weakness, or a duration you never rode all-out. The curve only shows what you have ridden flat out, so test that duration before you treat it as a weakness.
Many riders never sprint in training, never ride a full hour at their limit and only ride long days easily. Their curves show dips at 5 seconds, 60 minutes and 4 hours that say more about their habits than their legs.
Before you call a dip a limiter, the weakest part of the curve, ask one question: did I ride that duration all-out in this period? Then fill the gaps on purpose:
- Sprint: two or three sprints of 10 to 15 seconds from a rolling start, fully recovered between them.
- One minute: one hard minute on a short climb, after a good warm-up.
- Five minutes: a five-minute all-out effort on a steady climb or on the trainer.
- Twenty minutes: a threshold test or a hard climb paced evenly; the article on what FTP is covers how.
- Long: a three- to four-hour ride with one hard effort near the end.
Only then compare the shape again. A dip that survives honest testing is a limiter worth training. In Velograph, a limiter that may only be untested is shown as a question, not a verdict.
How do you compare power curves over time?
Compare whole curves over matching periods, such as the last 90 days against the 90 days before, rather than single rides. Weather, terrain, the group and motivation all change the numbers of a single ride.
You can also compare this season against the last. Before key efforts, zero the power meter (the head unit's calibration or zero offset), so a small drift does not look like progress.
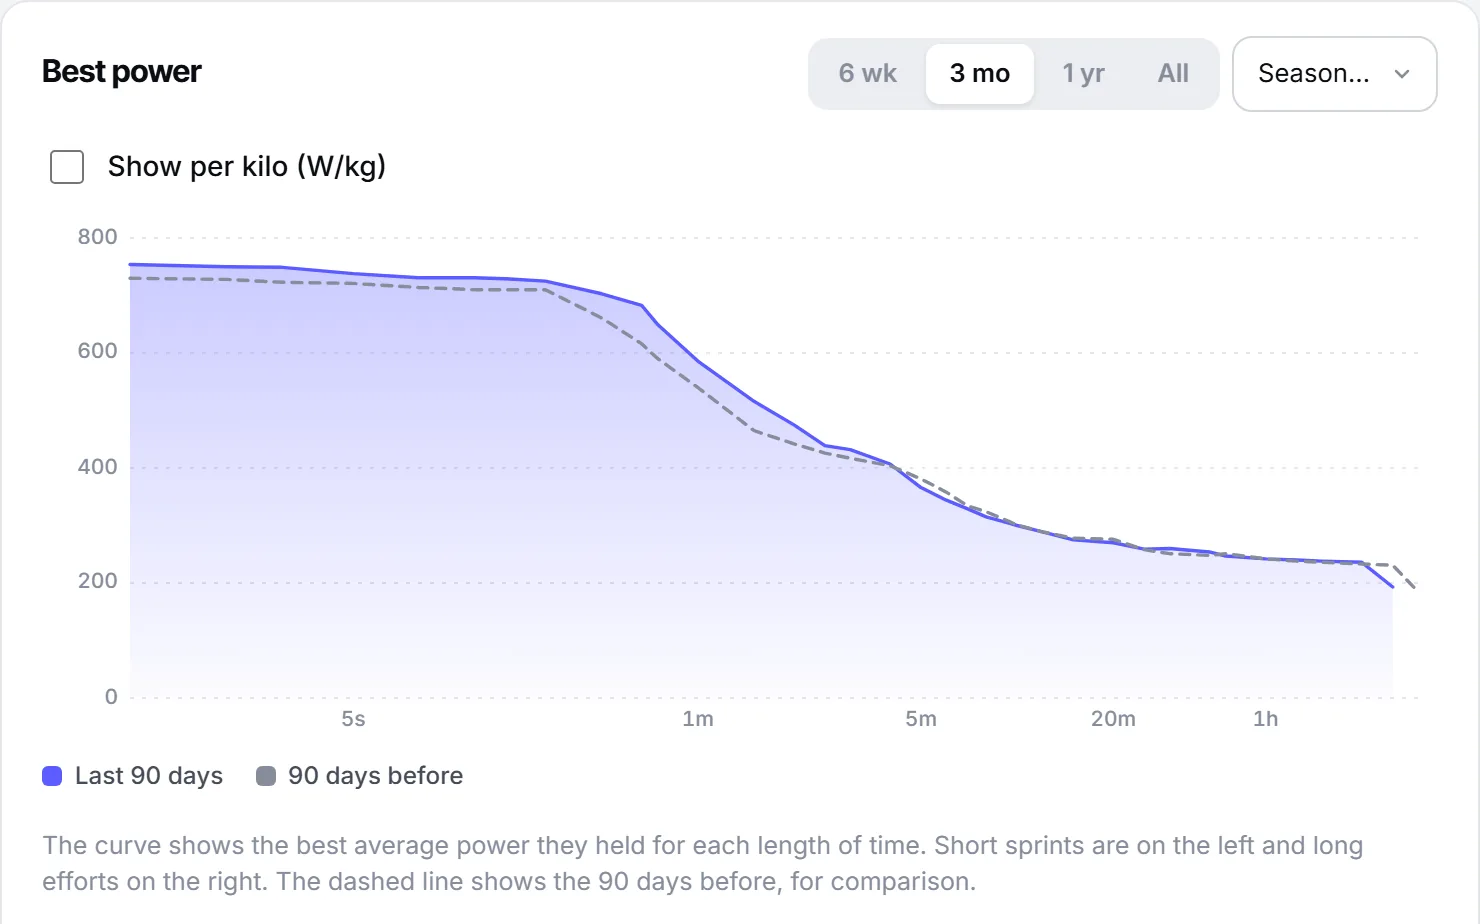
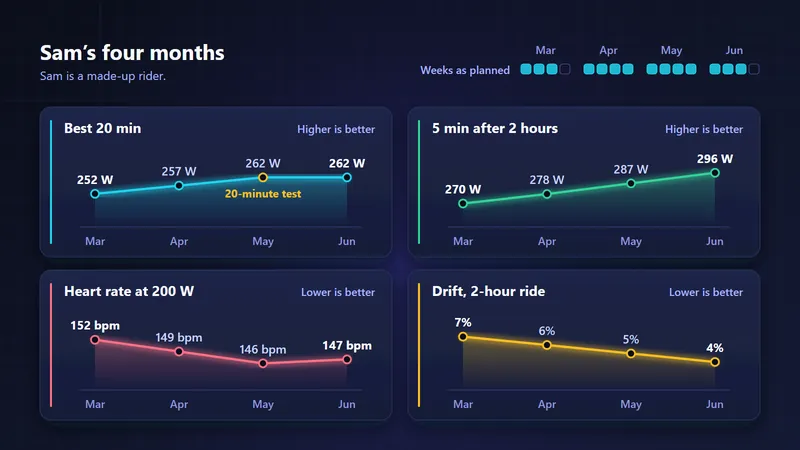
Look at sections, not points. If everything from 3 to 20 minutes rose about 4% while the sprint stayed flat, a threshold block did what it was meant to do. If the left end rose and the right end fell, the training has drifted towards intensity at the cost of endurance.
Then compare fresh with tired. Your five-minute power after two hours of riding may be well below your fresh five-minute power. That gap is durability, and in long races it decides more than the fresh curve does.
A five-minute routine for reading your own curve:
- Check the period and the data: one power meter, calibrated, no obvious spikes.
- Name the shape: which section stands highest against the rest?
- Lay the previous period over it and note which sections moved.
- Mark the durations you have not ridden all-out, and plan to test them.
- Choose one section to train for six to eight weeks, then compare again.
Further reading
- Power profiling, by Andrew Coggan, TrainingPeaks, 2008.
- Power profiling and the power-duration relationship in cycling: a narrative review, European Journal of Applied Physiology, 2022.
- The record power profile of male professional cyclists: normative values obtained from a large database, International Journal of Sports Physiology and Performance, 2022.
- The power profile predicts road cycling MMP, International Journal of Sports Medicine, 2010.
Velograph is not affiliated with, sponsored by or endorsed by any team, rider or company named in this article. Names are used only to refer to publicly reported work.