Review a cycling season with numbers and words: goals against results, load by month, power bests, tests, days lost, and three decisions for next year.
A cycling season review sets what you planned against what happened across the whole year, in numbers and in words, and ends with three decisions for next season. It takes about three hours over two or three weeks, including an hour's talk with a coach or a training partner. The template below has six tables and eight questions, filled in for Kim, a made-up amateur road racer who trains about seven hours a week.
When should you do an end-of-season review?
Do it in the first two or three weeks after your last race, while the season is fresh and before anyone writes next season's plan. The easy weeks after the last race leave time for it.
| Step | Who | When | Time |
|---|---|---|---|
| 1. Fill in the six tables | The rider, or the coach | The week after the last race | 45 minutes |
| 2. Answer the eight questions in writing | The rider, alone | The same week | 30 minutes |
| 3. Review meeting | Rider and coach | Within three weeks of the last race | 60 minutes |
| 4. Write the three decisions into next season's plan | Coach and rider | Within a week of the meeting | 30 minutes |
A race debrief looks at one race. The season review looks for patterns across all of them, so read the year's debriefs before the meeting. The same lesson written in three debriefs is a habit to train, not bad luck. A rider on their own can run every step; the page for riders says what a rider keeps without a team.
What should a cycling season review compare?
Compare six things with the plan and with last season: goals and results, training month by month, power bests, tests, days lost to illness or injury, and changes to kit and bike fit. Each fits in one small table that a rider can fill in from their training log.
Goals against results
| Goal | Target | Result | Met? | What made the difference |
|---|---|---|---|---|
| A race: regional road race championship | Top 10 | 14th | No | Missed the split on the last climb |
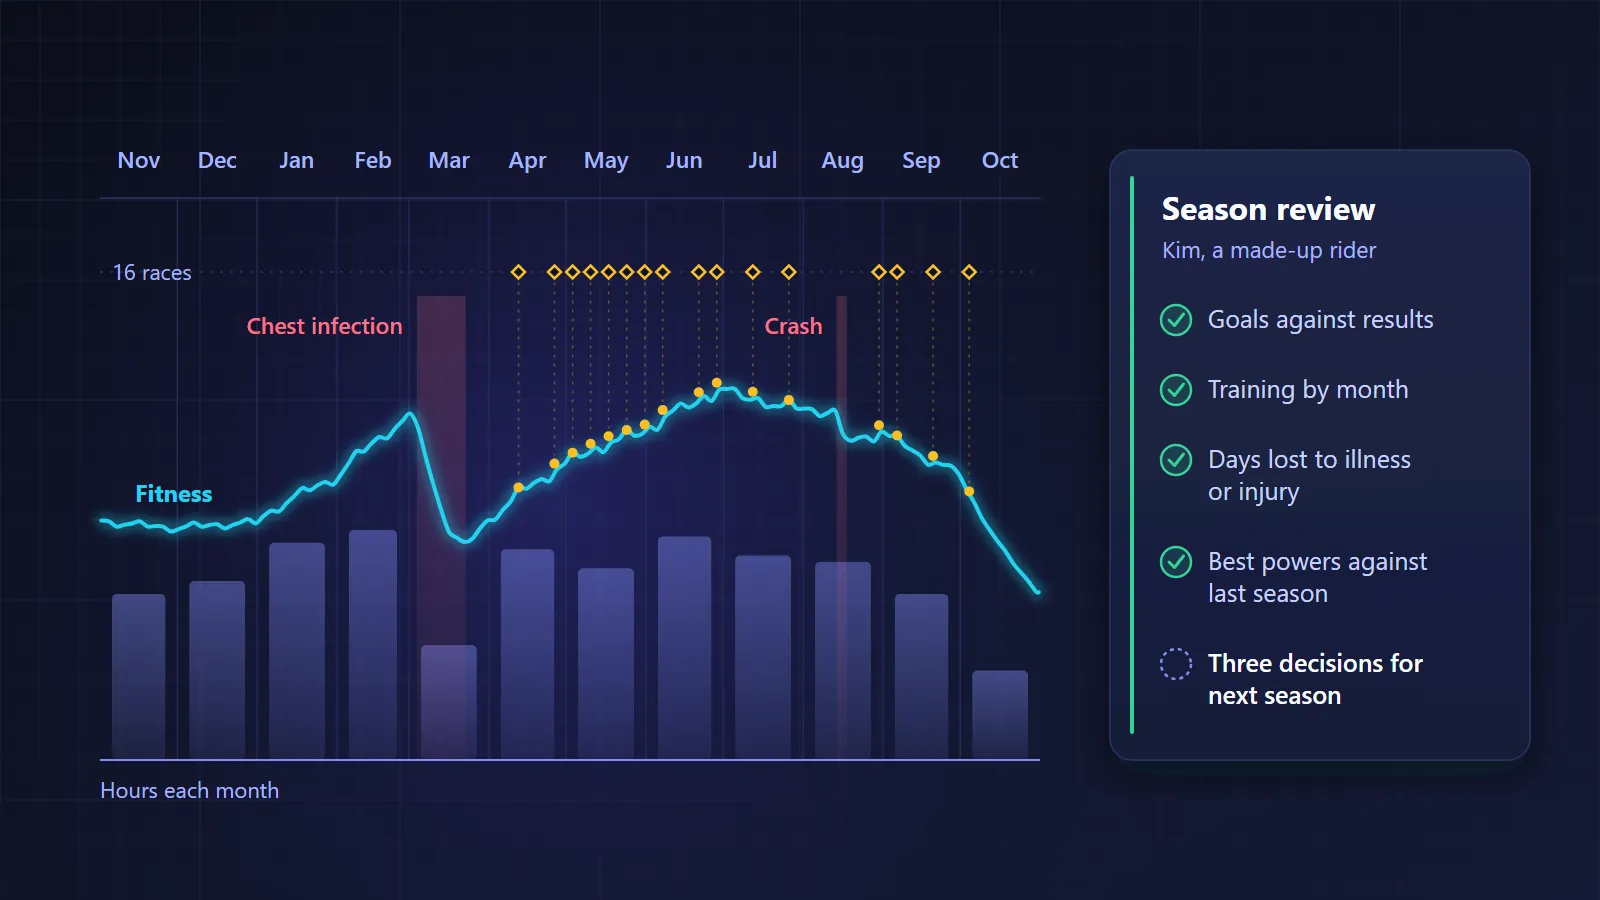
| Training hours, November to August | 8 a week | 7.0 a week | Partly | Three weeks lost to a chest infection in March |
| FTP | 280 W by June | 276 W in June | Nearly | The threshold block was cut short by the infection |
| Race fuelling | 70 g of carbohydrate an hour | Done in 13 of 16 races | Yes | Bottles mixed the night before |
| Enjoyment | 4 out of 5 or more in September | 3 out of 5 | No | Racing every weekend in May left no easy weekends |
Mix outcome goals, such as a place, with process goals, such as hours or fuelling. When the process goals were met and the result was not, look at the race before you change the training.
Training month by month
| Month | Hours | Rides | Training load | Days lost or reduced | Races |
|---|---|---|---|---|---|
| Nov | 26 | 14 | 1,450 | 0 | 0 |
| Dec | 28 | 15 | 1,500 | 0 | 0 |
| Jan | 34 | 17 | 1,900 | 0 | 0 |
| Feb | 36 | 18 | 2,050 | 0 | 0 |
| Mar | 18 | 9 | 980 | 19 | 0 |
| Apr | 33 | 17 | 1,950 | 0 | 2 |
| May | 30 | 16 | 2,100 | 0 | 5 |
| Jun | 35 | 17 | 2,200 | 0 | 3 |
| Jul | 32 | 16 | 1,900 | 0 | 2 |
| Aug | 31 | 15 | 1,850 | 4 | 1 |
| Sep | 26 | 13 | 1,500 | 0 | 2 |
| Oct | 14 | 9 | 700 | 0 | 1 |
Then count the weeks that went as planned, with the key sessions and the long ride done. Kim managed 40 of the 48 weeks before the last race, or 83%. That count matters more than any single month. In a five-year study of 33 elite track and field athletes, Raysmith and Drew (2016) found that those who completed more than 80% of their planned training weeks were about seven times more likely to reach their performance goal. It is an association in another sport, not proof, but it is a good reason to count weeks as well as watts. The guide to fitness, fatigue and form explains the load numbers.
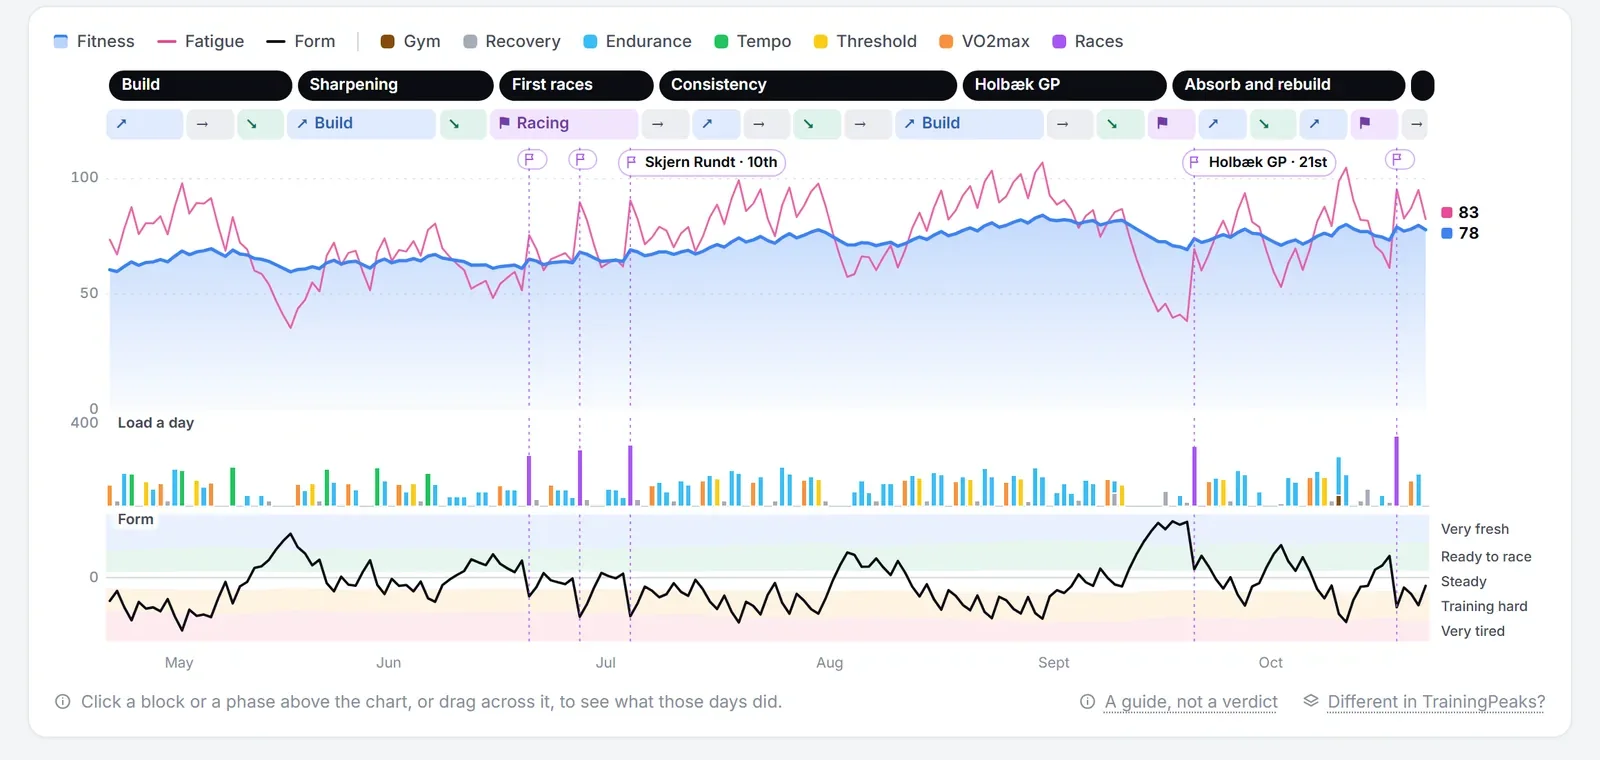
In Velograph, the fitness page can show a calendar year or any dates you choose, with a review of the period under the chart. It shows fitness at the start and the end, hours and load a week, which kinds of riding built the fitness, the rides that added most and any new bests at 5 seconds, 1, 5, 20 and 60 minutes.
Power bests against last season
| Duration | Last season | This season | Change | Ridden all-out this season? |
|---|---|---|---|---|
| 5 seconds | 980 W | 1,010 W | +3% | Yes, in sprints |
| 1 minute | 520 W | 529 W | +2% | Yes |
| 5 minutes | 345 W | 361 W | +5% | Yes, on climbs |
| 20 minutes | 290 W | 297 W | +2% | Yes, in a hilly race in June |
| 60 minutes | 262 W | 255 W | −3% | No |
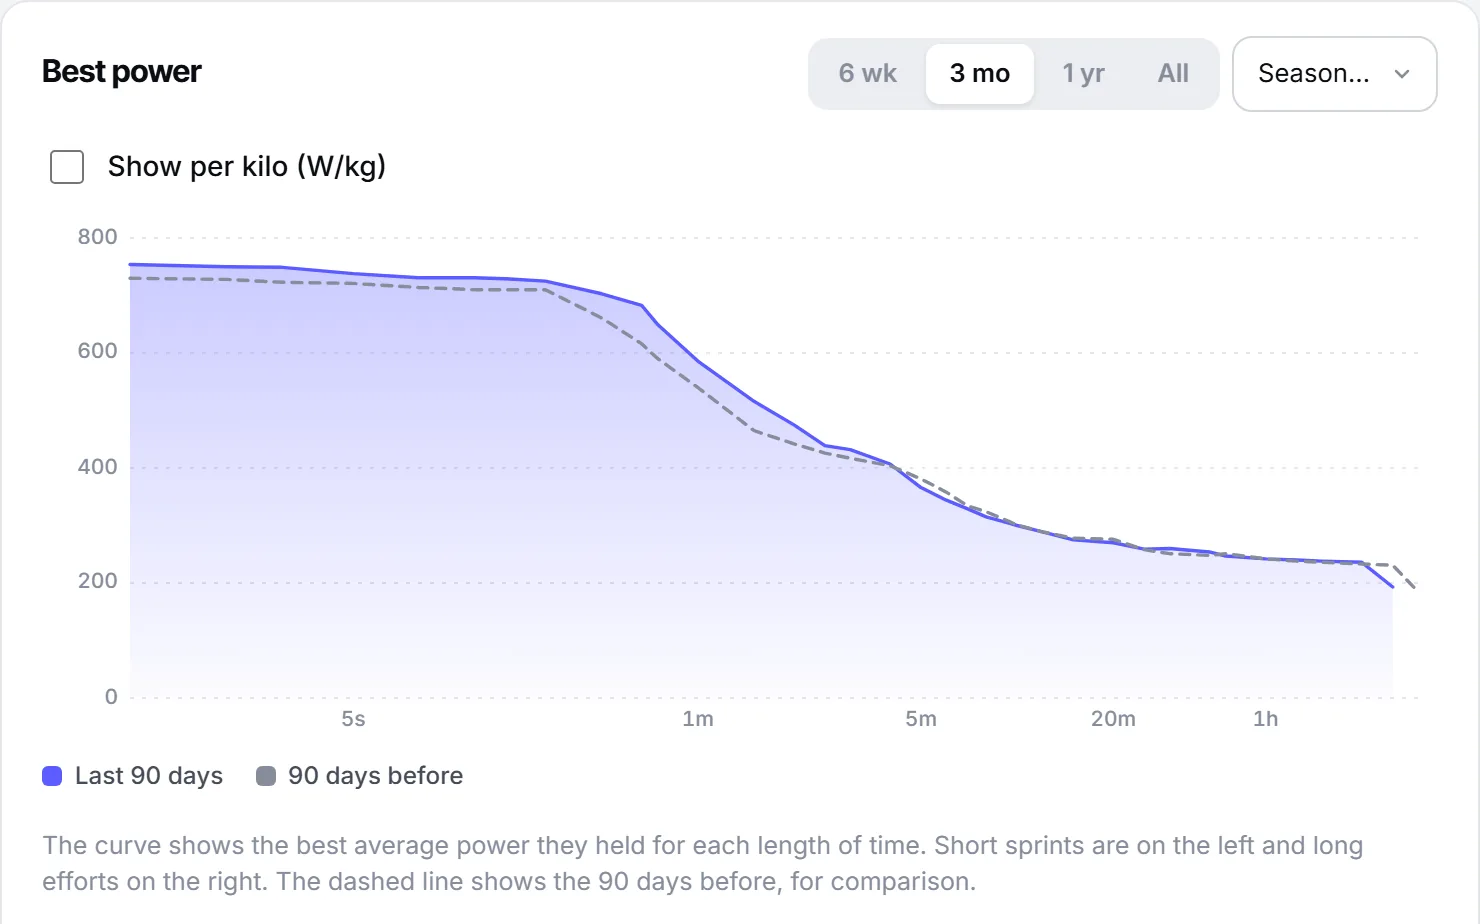
Mark every duration that was not ridden all-out. Kim's hour looks weaker, but nothing close to an hour was ridden flat out this season, so it is untested rather than lost. The article on reading a power curve shows how to tell the two apart.
Tests
| Date | Test | Result | Conditions |
|---|---|---|---|
| 13 January | 20 minutes, indoors | 284 W, FTP estimate 270 W | Same trainer and fan as last year |
| 9 June | 20 minutes, on a steady climb | 291 W, FTP estimate 276 W | 14 °C, light wind |
| 22 September | 20 minutes, indoors | 287 W, FTP estimate 273 W | Two days after a race |
The FTP estimate is 95% of the 20-minute power, the usual conversion. Compare indoor tests with indoor tests, and note anything that differed, such as a race two days before.
Days lost
| Dates | Cause | Days off the bike | Days reduced | What we changed |
|---|---|---|---|---|
| 4 to 22 March | Chest infection | 12 | 7 | Two easy weeks before intervals again, as the doctor advised |
| 14 to 17 August | Crash, grazes and a bruised hip | 2 | 2 | New helmet; bike checked by the mechanic |
The same illness twice in a season, or the same injury again, is a question for a doctor or physiotherapist rather than for the review.
Kit and bike fit changes
| When | Change | Why | What it did |
|---|---|---|---|
| February | Saddle 4 mm lower after a bike fit | Hips rocking on long rides | Steadier on long rides; numbness gone by April |
| April | 30 mm tyres instead of 28 mm | Rough roads in the spring races | More comfortable on the rough sections |
| July | Stem 10 mm shorter | Neck ache after three hours | Ache gone; position recorded for the next fit |
Date each change, so the next fitter starts from facts; the guide to bike fit history explains why.
Which questions should a rider answer about the season?
Answer eight questions alone and in writing before the meeting. They cover what you are proudest of, the best and worst race, when training felt good, what got in the way, what helped, what you would change, what you want next and what your coach should do differently.
- What are you proudest of from this season?
- Which race went best, and which went worst? What was different between them?
- When did training feel good, and when did you dread it?
- What got in the way: work, school, family, illness or travel?
- What helped most: a person, a habit or a piece of kit?
- What would you do differently if the season started again tomorrow?
- What do you want from next season, and why does it matter to you?
- What should your coach, or your team, do differently?
Then rate the season from 1 to 5 twice, once for results and once for enjoyment. Writing it down is worth the half-hour. A 2016 meta-analysis of 138 studies by Harkin and colleagues found that monitoring progress towards a goal helped people reach it, and more so when the progress was written down or reported to someone. It is a general finding about goals, not a cycling study.
How does a coach run a season review with each rider?
Book an hour with each rider. Let the rider tell the story of the season first, then go through the numbers together, and finish with three decisions you both agree on. In a team, the staff then review the season as a whole.
| Minutes | Part | Who leads |
|---|---|---|
| 0 to 15 | The rider's story: their answers to the eight questions | Rider |
| 15 to 35 | The numbers: goals, months, bests, tests, days lost, kit and fit | Coach |
| 35 to 50 | Where the story and the numbers agree, and where they do not | Both |
| 50 to 60 | Three decisions for next season | Both, written down by the coach |
The rider speaks first, so the season is told in their own words before any chart shapes it. When the story and the numbers disagree, ask about it. Kim called May the best month for results, yet the written answers named May as the month when training felt like a chore. Riders under 18 bring a parent, and each review stays between the rider and the staff who coach them.
After every rider has had a review, the staff meet with the same template for the whole squad. They look at the race programme, selection, which plans worked, and problems that came up for several riders, such as illness after travel or crosswind sections lost in three races.
How do you turn a season review into next season's plan?
Write three decisions: one thing to keep, one to change and one to try. Give each a measure and a date to check it. Then build next season's plan back from the new A race, with the three decisions written into its first weeks.
| Decision | Why, from the review | How we will know | Check |
|---|---|---|---|
| Keep two key sessions a week | Done in 40 of 48 weeks; 5-minute best up 5% | The same share of weeks done | Every four weeks |
| Change: one easy weekend in every three in the racing months | Five races in May; enjoyment 3 out of 5 | Enjoyment of 4 or more in June | End of June |
| Try: one long, hard effort each month from March | The hour best fell and was never tested | A 60-minute best ridden all-out by May | End of May |
Three is the limit. With ten decisions, nobody remembers any of them by March. Put the A race in the calendar and work backwards from it, as the annual training plan guide shows, then file this review where next October's review will find it.
Further reading
- Performance success or failure is influenced by weeks lost to injury and illness in elite Australian track and field athletes: a 5-year prospective study, Raysmith and Drew, Journal of Science and Medicine in Sport, 2016.
- Does monitoring goal progress promote goal attainment? A meta-analysis of the experimental evidence, Harkin and colleagues, Psychological Bulletin, 2016.
Velograph is not affiliated with, sponsored by or endorsed by any team, rider or company named in this article. Names are used only to refer to publicly reported work.