Fitness, fatigue and form explained with worked numbers: what the lines mean, how fast to build, how to taper for a race, and what the model cannot see.
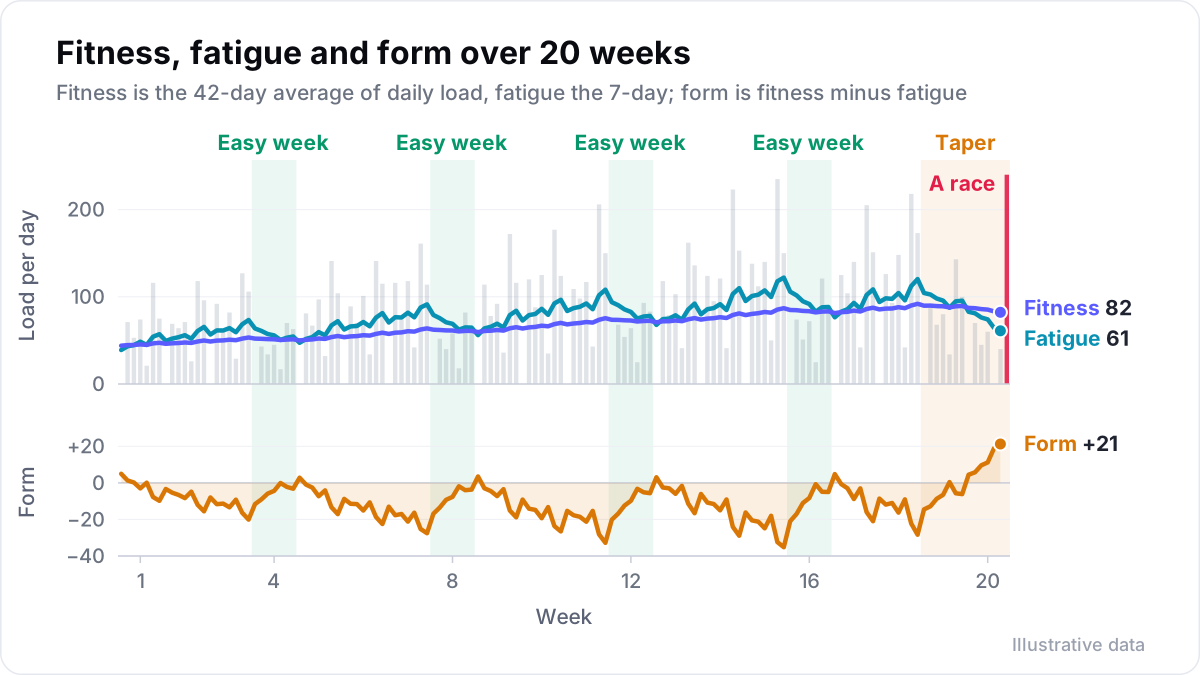
Fitness, fatigue and form are three lines drawn from one input: your daily training load. Fitness is a slow average of that load over roughly six weeks. Fatigue is a fast average over roughly one week. Form is fitness minus fatigue. Well below zero means you are tired from training; above zero means you are fresh. Read together over weeks, the lines show whether a block is building you up, digging a hole, or bringing you to a race ready.
Where does the fitness-fatigue model come from?
The model goes back to Eric Banister and colleagues, who proposed a systems model of training in 1975. They soon reduced it to two responses to every session, a small, slow gain in fitness and a larger, quicker rise in fatigue.
Performance on a given day is the first minus the second. Banister's group scored sessions from heart rate and duration, a measure they called the training impulse.
Andrew Coggan adapted the idea for power meters in the mid-2000s. He tested his Performance Manager with riders in the 2005 and 2006 seasons, and it became TrainingPeaks' Performance Management Chart. Its names became the standard vocabulary: chronic training load (CTL) for fitness, acute training load (ATL) for fatigue and training stress balance (TSB) for form. Its input, TrainingPeaks' Training Stress Score (TSS), set the scale: one hour at FTP scores 100. intervals.icu shows the same model as fitness, fatigue and form.
What do fitness, fatigue and form mean?
Fitness is a slow average of your daily training load, weighted over about six weeks, and fatigue is a fast one over about a week. Form is fitness minus fatigue. It is negative in weeks you train harder than your recent average and positive when you ease off.
Each ride gets a load score from its duration and intensity. On the usual scale, an hour at threshold is 100 points; an easy hour is about 40 to 50. Because intensity counts more than linearly, one hard hour scores more than two very easy ones.
- Fitness is an exponentially weighted average of daily load with a 42-day time constant. A fitness of 60 means you have averaged about 60 points a day, around 420 a week, with recent weeks counting most. Stop training and it halves in about four weeks.
- Fatigue is the same average with a 7-day time constant. It reacts within days and halves in about five days of rest.
- Form is fitness minus fatigue. It is negative in any week you train harder than your recent average and positive when you ease off.
Form makes most sense relative to fitness. Minus 20 is a very hard week for a junior with a fitness of 30 and an ordinary one for a professional at 120. That is why intervals.icu added an option in 2020 to show form as a percentage of fitness. A reading guide relative to fitness:
| Form as a share of fitness | What it usually means |
|---|---|
| Above +25% | Very fresh. Right for a target race; if it lasts, fitness is slipping. |
| +5% to +25% | Rested and fit: the window for racing. |
| -10% to +5% | Neutral: steady training or a light week. |
| -30% to -10% | Tired in the way that builds fitness. |
| Below -30% | Deep fatigue. Fine for a planned camp, a warning sign if it was not planned. |
These are the bands Velograph's fitness page uses. Other tools draw similar ones, and none of them is a diagnosis.
A worked example: one big week
Take a rider whose fitness and fatigue both sit at 60. They ride a training camp of seven 150-point days, then a recovery week averaging 30 points a day.
| Point | Fitness | Fatigue | Form |
|---|---|---|---|
| Before | 60 | 60 | 0 |
| After the first camp day | 62 | 72 | -10 |
| After seven days at 150 | 74 | 117 | -43 |
| After seven easy days at 30 | 67 | 62 | +5 |
The camp pushes form to about minus 58% of fitness, far below the -30% line. After an easy week, form is back above zero and the rider keeps a fitness gain of about 7 points, or 12%. That is how a well-planned block works: a deliberate dip, then recovery to bank the gain. Planning a training camp covers how to ramp into the week and out of it.
What is a good ramp rate in cycling?
Joe Friel, writing for TrainingPeaks, suggests a ramp of 5 to 8 fitness points a week as about right for most athletes. After a few weeks of that, he suggests a short break. Riders with lower fitness should read ramp guidance as a share of fitness, where a steady build gains a few percent a week.
The ramp rate is how much fitness rises in seven days. Some elite athletes handle more than 10 points a week, but Friel advises keeping that to a week or less.
A point is not the same size for everyone. Under the model, a week's fitness gain depends on how far that week's load sits above your current fitness:
| Week's load compared with your recent average | Fitness rises by about |
|---|---|
| 10% more | 1.5% |
| 25% more | 4% |
| 50% more | 8% |
| Double | 15% |
A ramp of 5 points asks a rider at fitness 50 to train about 65% more than their recent average that week, while a rider at 100 needs a third more. Riders with lower fitness should read ramp guidance as a share of fitness. A steady build gains a few percent a week; 10% or more in a week is a camp or a crash. Three building weeks and one easier week is a common rhythm; the annual training plan puts those blocks in order.
How long should you taper before a race?
A taper of about two weeks gave the largest gains in a 2007 meta-analysis by Bosquet and colleagues. Training volume fell by 41 to 60%, while intensity and the number of sessions stayed the same. Short, race-pace efforts stay in, and the long rides get shorter.
A taper trades a little fitness for a lot less fatigue. For a rider at a steady fitness of 80, ten days at 50 points a day leaves fitness at about 74 and fatigue at about 57. Form is about +16, or +22% of fitness: inside the racing window. Two weeks at that lower load gives more form but loses more fitness.
Professionals do not always follow the textbook. A 2022 case study looked at three riders who finished in the top five of the Giro d'Italia, and found their tapers followed their race schedules rather than published recommendations. Racing itself was part of the preparation.
What can't training load tell you?
Training load cannot tell you how you slept, whether you are ill, how hot it was, how stressed you are at work or what you ate. The model only knows the load you recorded, so two riders with identical charts can be in very different shape.
- Load depends on your threshold. If FTP is set too low, every ride scores too high and fitness looks better than it is.
- The time constants are nominal. Coggan has written that the 7-day fatigue constant strongly affects form, and that some athletes fit better with 4 to 5 days or 10 to 12.
- Individual fits are uncertain. In a 2006 study of elite swimmers, Hellard and colleagues found the model tracked performance. Its key parameters, though, had wide confidence intervals and some were strongly correlated, which made them hard to interpret.
- Fitness is not performance. A high number built from easy riding does not raise your five-minute power. Check the trend against tests and your power curve.
- Missing rides make fitness fall. A ride without a file, or a gym session with no score, looks like a rest day.
For the daily signals the chart misses, HRV training explains what heart rate variability can and cannot add.
How do you read your training load chart week to week?
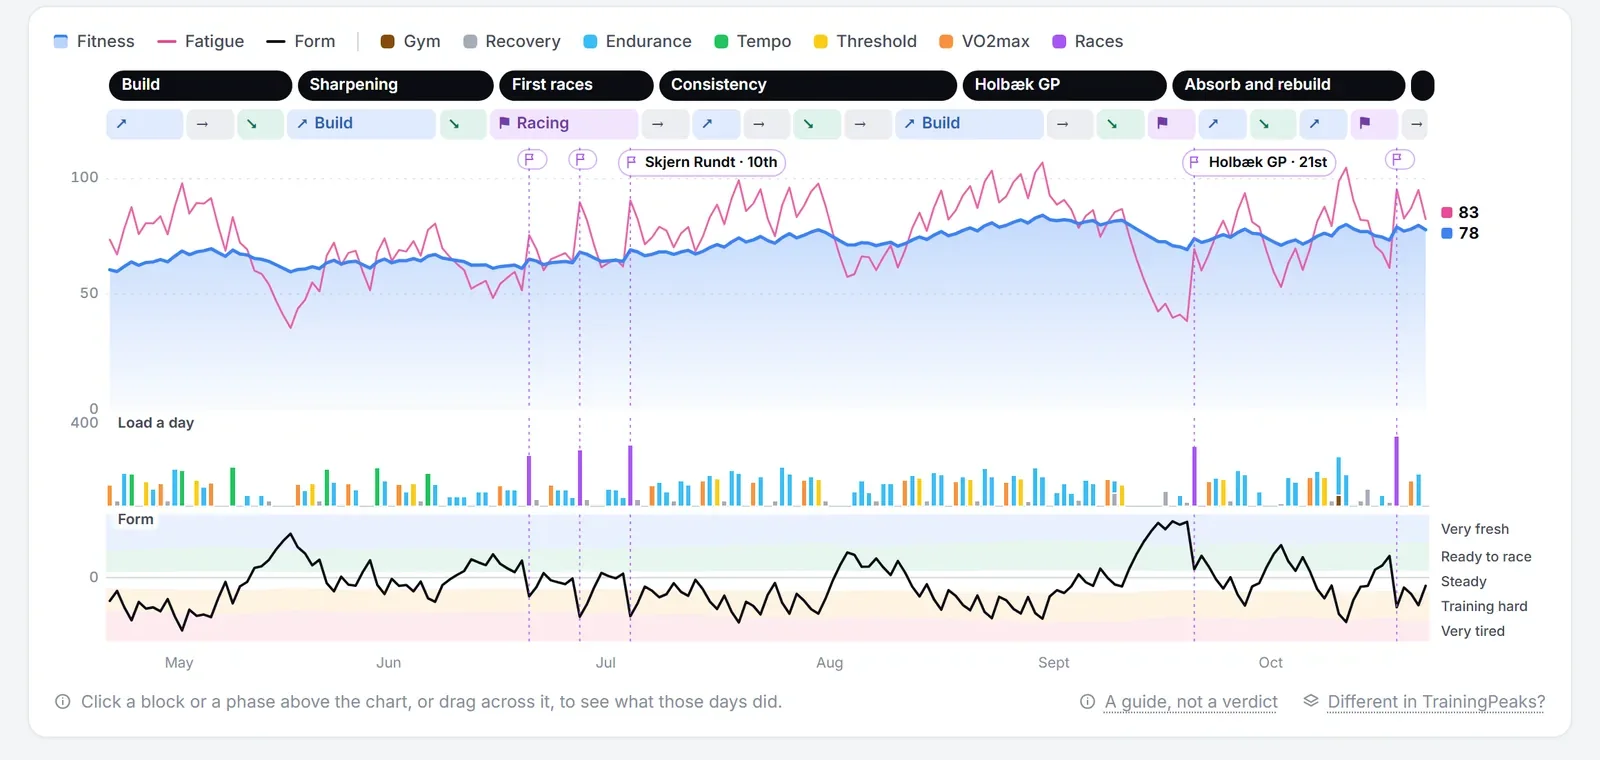
Look at weeks, not days, and plan form for the target race first. Keep the weekly ramp to a few percent of fitness, and expect form near zero after each recovery week. Check the chart against how the rider feels, sleeps and performs.
A short routine for riders and coaches:
- Look at weeks, not days. One big ride moves fatigue a lot and fitness a little.
- Plan form for the target race first, then plan the build backwards from it.
- Keep the ramp at a few percent of fitness in normal weeks. Make spikes deliberate and follow them with recovery.
- Expect form near zero or slightly positive at the end of each recovery week. If it stays deeply negative, the recovery week was not easy enough.
- Check the chart against the rider. How do they feel, sleep and perform? When the chart and the rider disagree, believe the rider and look for the cause.
- Compare riders fairly. Read form as a share of each rider's own fitness. Velograph's fitness page can show up to eight riders side by side.
A structured training plan turns these numbers into sessions; the chart then tells you whether the plan was ridden and what it did.
Further reading
- The science of the Performance Manager, Andrew Coggan, TrainingPeaks, 2022.
- Why ramp rate is an important training metric, Joe Friel, TrainingPeaks, 2015.
- Effects of tapering on performance: a meta-analysis, Bosquet and colleagues, Medicine and Science in Sports and Exercise, 2007.
- Assessing the limitations of the Banister model in monitoring training, Hellard and colleagues, Journal of Sports Sciences, 2006.
Velograph is not affiliated with, sponsored by or endorsed by any team, rider or company named in this article. Names are used only to refer to publicly reported work.