A Grand Tour rider's six seasons, pro women's best years, a Zwift Academy winner and two triathletes: what each measured, and what you can copy.
Data-driven training means you measure your training, look at the numbers and let them shape the next block. Five published examples stand out: two studies of professional cyclists, the Zwift Academy and two triathletes whose numbers are on record. None of them proves that data alone made anyone faster. Together they show what careful measuring looks like, and most of it can be copied with a bike computer and a notebook.
Does data-driven training work?
The published cases show athletes who measured carefully and improved, but none can prove that the data caused the improvement. They do show that a long, honest record lets an athlete and a coach see what changed and plan the next step from it.
Evidence comes in three strengths. A case study describes one athlete and has nothing to compare with. An observational study compares many athletes or seasons but cannot separate cause from effect. A controlled trial compares a data-guided plan with a fixed one, and in cycling the clearest trials test plans guided by heart rate variability. The five cases below are of the first two kinds, or athletes' own accounts. Why recording and reviewing helps at all is covered in our guide to cycling training data.
What do the documented cases show?
The documented cases show five ways of measuring. One rider's power and load were kept for six seasons, and professional women's files were compared season by season. Indoor tests led to a pro contract, a lab measurement was set beside three years of logged hours, and a power meter changed how a triathlete rode.
How did one rider's numbers change on the way to a Grand Tour top 10?
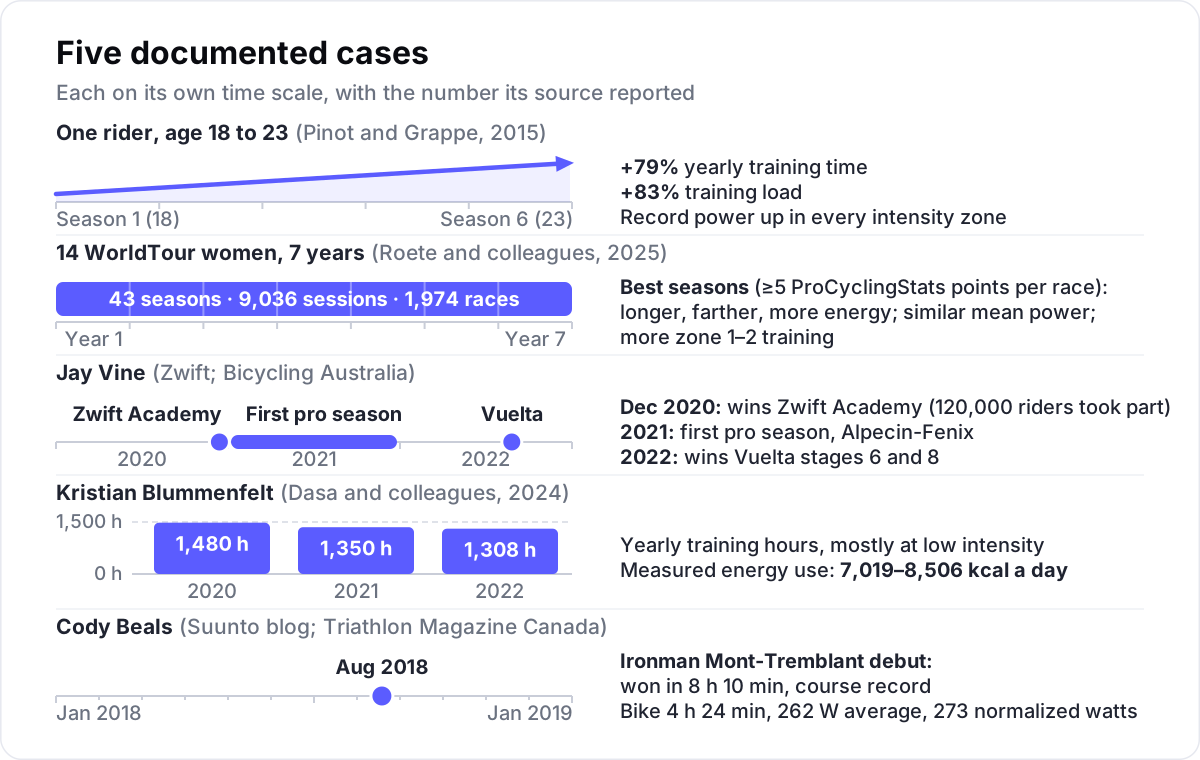
Over six seasons, from age 18 to 23, the rider's yearly training time rose by 79% and his training load by 83%. His record power improved in every intensity zone. The study, published in 2015, describes him as a top-10 finisher in the Tour de France and the Vuelta.
Julien Pinot and Frédéric Grappe built this case from the rider's power files from training and races. They kept a record power profile, his best power at each duration, season by season. They counted training load with the session rating method: how hard each session felt from 0 to 10, multiplied by its minutes. The rise in load was linked to higher record power at durations from 5 minutes to 4 hours.
For scale, 79% more is the step from 10 to about 18 hours a week, although the paper's summary does not give his hours. The case cannot show what would have happened without the data, because a gifted rider grows stronger between 18 and 23 anyway. It also shows that a future Grand Tour rider's load was followed with a measure that needs no sensor. The power curve explained shows how to keep the same kind of profile.
What did pro women do differently in their best seasons?
In their more successful seasons, professional women trained for longer, rode farther and used more energy, while their average power stayed about the same. A 2025 study found that they also trained more in zones 1 and 2, the easiest zones.
Annemiek Roete, Teun van Erp and colleagues studied 43 seasons of 14 riders in WorldTour teams over seven years. That is about 9,000 training sessions and nearly 2,000 races. Each season was rated by ProCyclingStats points per race, and 5 points or more counted as highly successful. In those seasons the riders spent less of their racing time in zone 5, the hardest zone. Measures of internal load, the strain the work put on the body, did not differ.
The authors call the study exploratory, and it cannot show which came first. A good season brings selection for longer races, which adds hours and energy by itself. Still, it points the same way as the first case, towards more hours, and here the extra hours were mostly easy. Polarised training explains how time in zones is counted.
Can training data on Zwift lead to a pro contract?
It did for Jay Vine. He won the 2020 Zwift Academy, an online talent search judged on ramp tests, workouts and races, and with it a contract with Alpecin-Fenix for 2021. In 2022 he won stages 6 and 8 of the Vuelta a España.
Zwift reported 120,000 riders in the 2020 Academy, a record at the time, and the pandemic meant the finalists rode the finals from home. Bicycling Australia reported that three years before his Vuelta wins, Vine did most of his riding on a home trainer. Here the data opened the door to a professional contract for a rider of 25. The stage wins came later, from racing on the road. Talent identification in cycling covers the Academy and what indoor numbers can and cannot show about a young rider.
What did a world champion triathlete's training log record?
Kristian Blummenfelt's training log recorded 1,480 hours in 2020, 1,350 in 2021 and 1,308 in 2022, mostly at low intensity. A 2024 peer-reviewed paper set those records beside his measured energy use, 7,019 to 8,506 kcal a day.
The paper's title calls him an Olympic and Ironman world champion, and his coach, Olav Aleksander Bu, is one of its authors. The energy use was measured with doubly labelled water. In this method the athlete drinks water marked with stable isotopes, and urine samples show how much energy the body used. The logged hours work out at roughly 28, 26 and 25 hours a week.
The paper is about the upper limits of human energy use, not about what made him win. Its lesson for anyone else is the record itself, kept complete enough for scientists to use. Fuelling a lot of training is a job for a registered sports dietitian. The guide to double threshold training covers what is known about the Norwegian approach.
Can a power meter turn a weak discipline into a strong one?
Canadian triathlete Cody Beals says a power meter did that for his cycling. A 2018 post on the watch maker Suunto's blog says cycling was his weakest discipline when he started and had become his strongest. He called getting a power meter a revelation.
"With a power meter I learned to make every minute of my riding count," he said. In August 2018 he won Ironman Mont-Tremblant, his debut over the full distance, in a course record of 8 hours 10 minutes. Triathlon Magazine Canada reported that his bike split of 4 hours 24 minutes was also a course record. By his own comments on the file, he averaged 262 W, or 273 normalized watts. He had aimed for about 270 W in the first lap, then faded, and he did not think the ride was well executed.
An athlete's account on a maker's blog is a story, not evidence, although the race results are on record. The power file is the useful part, because it made a fade visible even in a course record. Our guide to time trial pacing explains why an even effort usually beats a fast start.
What do these cases have in common?
Most of the five cases share three habits. A few numbers were recorded the same way for a long time, someone besides the athlete read them, and the athlete was compared with their own earlier numbers. None of them used data in place of training.
- Few numbers, kept long. Hours, training load and best power at set durations carry most of these stories.
- Someone else reads them. A coach, a researcher or a team analyst looked at most of the records here.
- The athlete is the baseline. The Grand Tour rider is compared with himself at 18, and the women's best seasons with their weaker ones.
- Volume came first in both studies. Better results came with more hours, and in the women's study the extra time was mostly easy riding.
What can an amateur copy from data-driven training?
Copy the habits, not the volume. Record every ride the same way, keep a few test numbers across seasons, have someone else look at them, and compare yourself with your own last year. The pros' hours and lab tests are not the part worth copying.
Rate every ride. Note its duration and how hard it felt from 0 to 10. That was enough to measure load in the six-season case.
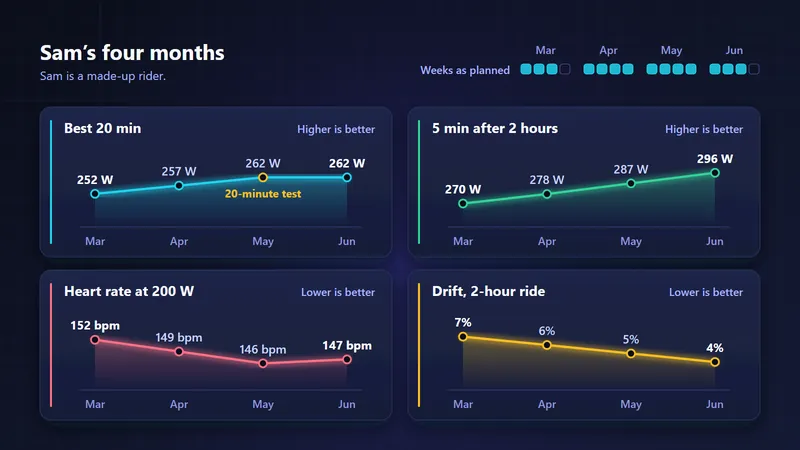
Keep the same few test numbers. Use your best 5-minute and 20-minute power, and your power after two hours of riding, which shows your durability.
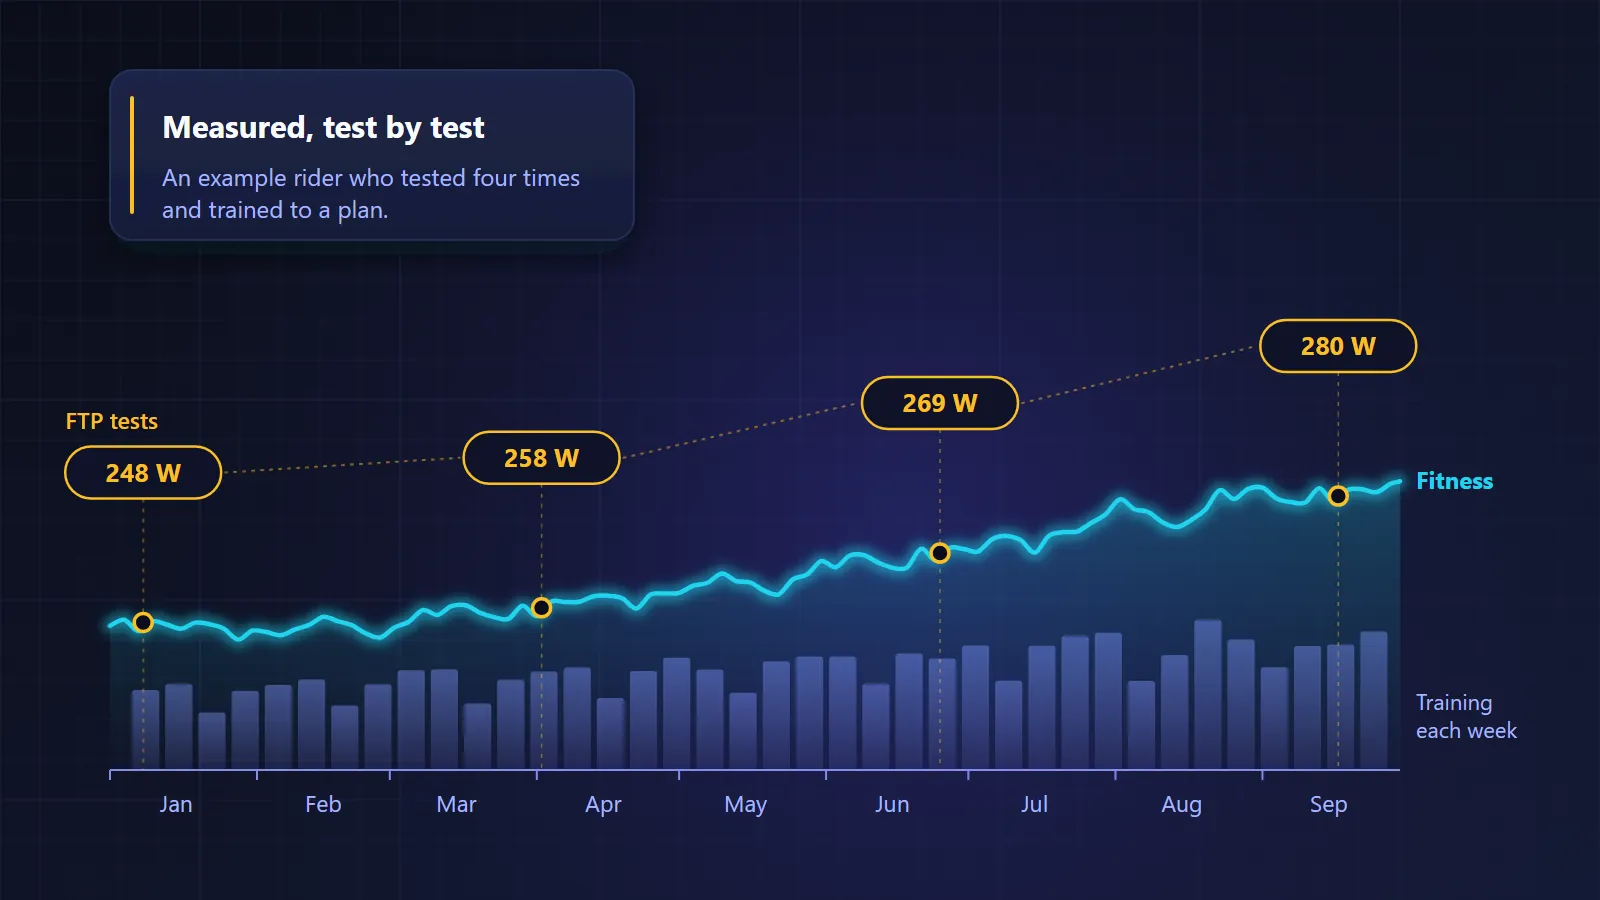
Test the same way each time. Use the same climb or trainer, warm-up and time of day, as in the testing method behind marginal gains.
Look back once a year. Fill in one row per season and compare it with the rows above.
Let someone else read it. A coach, a club mate or a training partner sees what you have stopped noticing.
A season record needs only six columns. The figures below are made up for one rider; the layout is the point.
| Season | Hours | Best 5 min | Best 20 min | 5 min after 2 hours | Note |
|---|---|---|---|---|---|
| 2024 | 260 | 300 W | 255 W | 270 W | Two weeks ill in March |
| 2025 | 310 | 312 W | 266 W | 290 W | More long easy rides, new bike fit in May |
| 2026 | 330 | 318 W | 272 W | 301 W | First stage race |
If you would rather not keep the files yourself, Velograph's free Rider plan keeps your rides, with ride analysis and your power curve, and has no end date. See what a rider gets on their own.
What can't these cases prove?
These cases cannot prove that data made anyone faster. A single case has nothing to compare with, an observational study cannot separate cause from effect, and a story on a maker's blog is not independent. Talent, coaching, health and luck shaped every result here.
Read them as examples of method. Each shows a number worth recording, a way to compare it over time, and someone who looked at it. That much is within reach of any rider.
Further reading
- A six-year monitoring case study of a top-10 cycling Grand Tour finisher, Pinot and Grappe, Journal of Sports Sciences, 2015.
- Internal and external load characteristics in professional female cyclists during highly successful and less successful seasons, Roete and colleagues, International Journal of Sports Physiology and Performance, 2025.
- Training volume and total energy expenditure of an Olympic and Ironman world champion, Dasa and colleagues, Journal of Applied Physiology, 2024.
- 2020 Zwift Academy Road winners announced, Zwift, 2020.
- Cody Beals's power file from Mont-Tremblant, Triathlon Magazine Canada, 2018.
Velograph is not affiliated with, sponsored by or endorsed by any team, rider or company named in this article. Names are used only to refer to publicly reported work.