What research says about tracking your training, which numbers to record first, what each one tells you, and how much cycling data is enough.
Cycling training data helps you improve only when someone looks at it and changes something. Research on goal progress, activity trackers and training logs points the same way. A record you review makes reaching a goal more likely. How you say you feel also shows your response to training at least as well as many lab measures. The useful minimum is short: how long you rode, how hard it felt and one line about how you were. Add power or heart rate when your devices give them.
Does tracking your training make you faster?
Tracking alone does not make you faster, but it makes reaching a goal more likely. In a review of 138 experiments, people who monitored their progress reached their goals more often. The effect was larger when they wrote progress down or shared it.
That review, by Benjamin Harkin and colleagues (2016), pooled randomised studies with almost 20,000 participants. People who were helped to check their progress did so far more often, and they reached their goals more often than people who were not. The effect was small to moderate (a standardised effect of 0.40), and how often people checked explained much of it.
Activity trackers show the same pattern. Ty Ferguson and colleagues (2022) gathered 39 reviews covering about 164,000 people. Programmes that used a tracker raised activity by the equivalent of about 1,800 steps, or 40 minutes of walking, a day.
Neither study shows that a power meter makes anyone faster. They suggest why a record helps. It puts the gap between what you planned and what you did in front of you, and that gap is what you act on.
What training data should a cyclist record?
Record three things for every ride: how long it lasted, how hard the whole ride felt from 0 to 10, and one line about how you were. Add power and heart rate if your devices record them, and check your best efforts every six to eight weeks.
- Every ride: the duration, a 0-to-10 rating of the whole session, the file from your bike computer or watch, and a note about sleep, legs or illness.
- Every morning, if you like: resting heart rate or heart rate variability, hours slept, and how you feel on a scale of 1 to 5.
- Every week: hours ridden against the plan, whether the key sessions were done, and your training load and form.
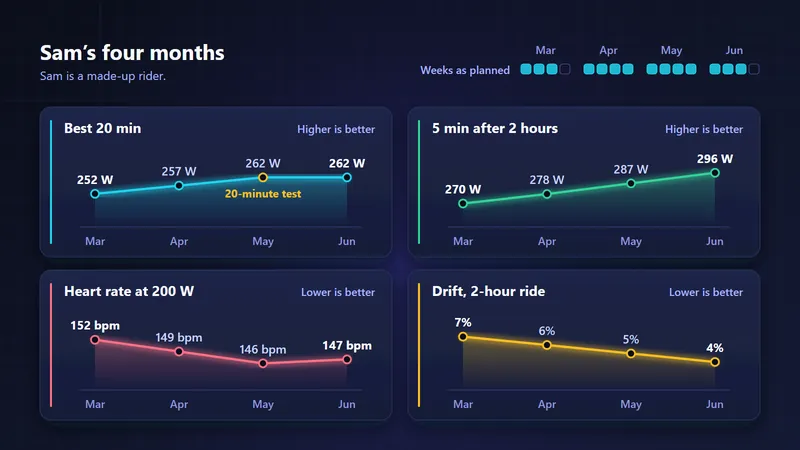
- Every six to eight weeks: a test or your best efforts at about 5 and 20 minutes, so you can see your power curve move.
- When something changes: the date of a new bike, bike fit or power meter, so you can explain a jump in the numbers later.
The 0-to-10 rating costs nothing and is easy to skip. Multiply it by the minutes of the ride, and you have a training load score that needs no sensor. A 75-minute ride rated 6 scores 450. Carl Foster and colleagues proposed this session rating in 2001.
How you feel is worth recording too. Anna Saw and colleagues (2016) reviewed 56 studies that measured athletes' well-being both ways. Questionnaires on mood, stress and recovery responded to changes in training load more sensitively and consistently than blood markers, heart rate and other common objective measures.
What does each number tell you?
Each number answers one question. Time shows how much you rode, and power shows the work you did. Heart rate and your 0-to-10 rating show what that work cost you, and your best efforts show what you can do.
| Number | What it tells you | What it misses |
|---|---|---|
| Time ridden | How much you trained | How hard it was |
| 0-to-10 rating × minutes | What the ride cost you, from your side | Which part of the ride was hard |
| Heart rate | How your body responded to the work | Short efforts, because heart rate lags; heat, caffeine and illness raise it |
| Power | The work you did, second by second | How tired you were while doing it |
| Training load | Duration and intensity in one score per ride | Sleep, stress and illness; it is only right if your FTP is up to date |
| Fitness, fatigue and form | How your load has built up over weeks | Anything you did not record |
| Best efforts and power curve | What you can do at each duration | Durations you have not ridden hard lately |
| Durability | How much power is left late in a long ride | It needs long rides with a hard effort near the end |
| Resting heart rate, HRV and sleep | How you are recovering | One morning on its own means little |
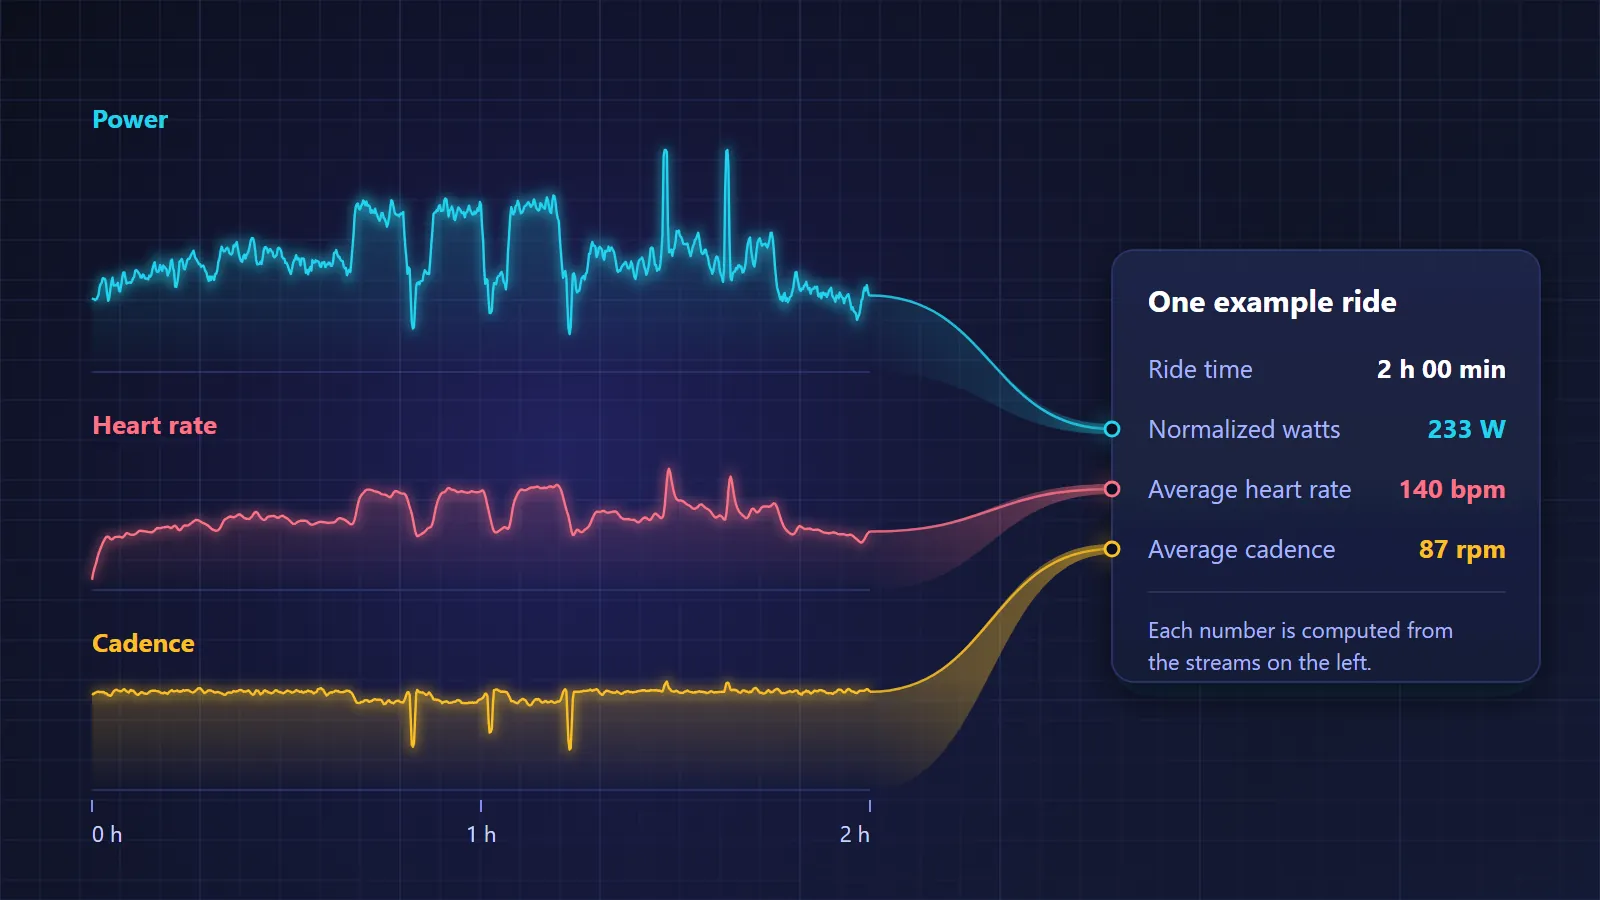
Power is the most direct measure of the work, but one summary of it hides a lot. Louis Passfield and colleagues (2017) concluded that mobile power meters are valid and reliable in the field. They also showed that a summary such as the average says little about how the power was spread over a ride. Take two 2-hour rides that both average 200 W. One is steady, and the other has ten hard sprints with coasting in between. The second ride is far harder, which is why time in zones, best efforts and normalized watts exist.
The numbers work best when they are set from your own body. Dajo Sanders and colleagues (2017) followed 15 competitive cyclists through 10 weeks of winter training. Every load measure they tried, the 0-to-10 rating included, was related to the riders' change in fitness. Measures built on each rider's own physiology were related most closely. Our guide to fitness, fatigue and form explains how load becomes those three lines, and heart rate vs power explains when each is the better guide.
How much training data is enough?
Enough is the data you will look at every week. For most riders that means duration, a 0-to-10 rating and a note for every ride, a ten-minute review each week, and best efforts every six to eight weeks. More data helps only if it changes a decision.
| Level | What you record | What it lets you decide |
|---|---|---|
| No power meter | Time, 0-to-10 rating, a note, heart rate if you have it | Whether the week was harder or easier than planned, and when to back off |
| Power meter | All of the above, plus power | Interval targets, pacing, training load and your power curve |
| Detailed | All of the above, plus morning HRV or resting heart rate, sleep and regular tests | Small changes to hard days, and long-term checks on how you respond |
Start at the first level and move up only when you know what question the next sensor will answer. A rider who records time, a rating and a note, and reads them every Sunday, has better data than a rider with five sensors who never opens the files.
How do you turn training data into better results?
Use a loop: plan the week, ride it, record each ride, review once a week and change one thing. The numbers matter less than closing the loop, because a record that nobody reviews changes nothing.
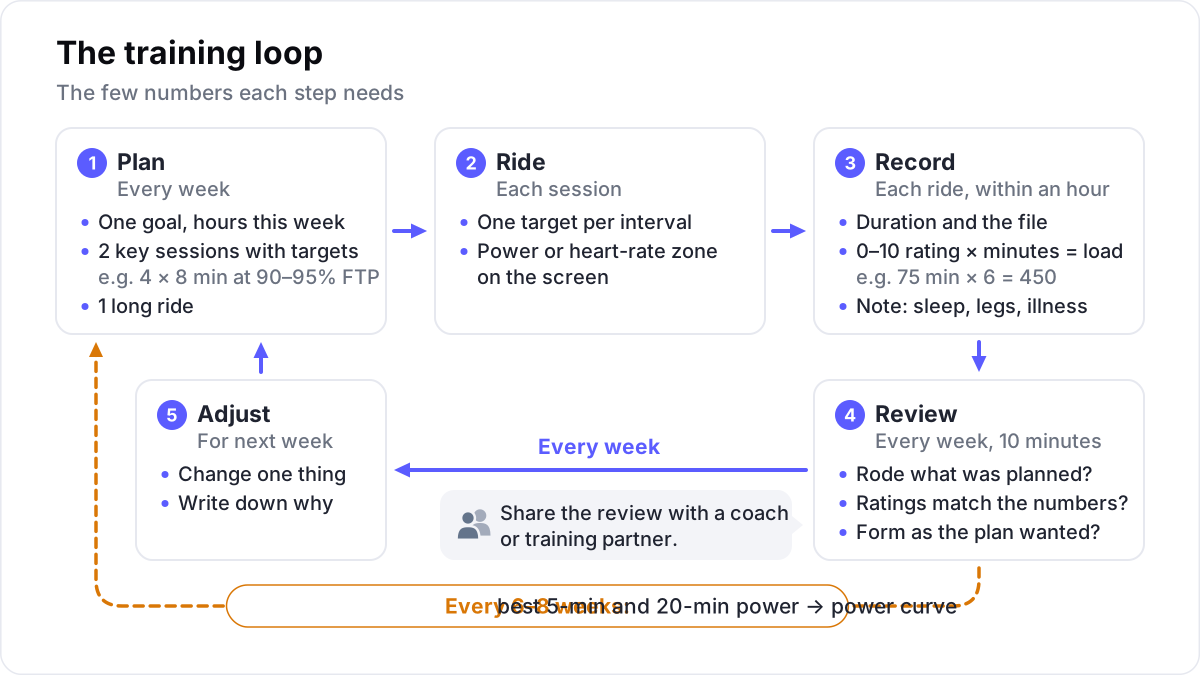
Plan. Write one goal, the hours you have this week, two key sessions with targets and one long ride. A target is a number: 4 × 8 minutes at 90 to 95% of FTP, or a heart-rate zone.
Ride. Ride each interval to its target and look at one number at a time on the screen.
Record. Within an hour of finishing, save the file, give the ride its 0-to-10 rating and write the note.
Review. Once a week, spend ten minutes on three questions. Did you ride what you planned? Do your ratings match the numbers? Is your form where the plan wanted it this week?
Adjust. Change one thing for next week and write down why. Changing one thing at a time is the method behind marginal gains, and it shows you what worked.
Show the weekly review to someone else, such as a coach, a training partner or a club captain. In Harkin's review, progress that was reported to others or made public had a larger effect than progress kept private. The self-coached cyclist guide has a fuller weekly checklist and the signs that say it is time to back off.
A notebook is enough for the loop. If you would rather keep it in one place, Velograph's free Rider plan has no end date. It keeps your bikes, your bike fits and your rides from FIT files, intervals.icu and Strava, with ride analysis, your power curve and fitness and form charts. Strava rides are shown to you only and are never used by the AI. See what a rider gets on their own.
How do professional teams use training data?
Professional teams use data to support people's decisions, not to replace them. Lidl-Trek has described analysts who turn riders' files into reports for coaches, sports directors, doctors and nutritionists. Mathieu Heijboer, Visma | Lease a Bike's head of performance, said in May 2026 that the team is above all people-driven.
He added that its riders are coached to race on feel. Both accounts fit the loop above, run by more people.
Where does training data mislead?
Training data misleads when a device is wrong, when your reference numbers are out of date, or when one number stands in for the whole picture. A stale FTP, a power meter that was not zeroed or a single low HRV reading can each send you the wrong way.
- The power meter was not zeroed. Do the zero offset as the maker's manual describes.
- Two devices give two numbers. A smart trainer and power pedals rarely agree exactly, so compare rides recorded on the same device.
- Your FTP is out of date. If it is set too low, every ride looks harder than it was, and fitness looks higher than it is.
- An untested duration looks like a weakness. If you have not ridden all-out for one minute in months, your one-minute power only looks low.
- A ride is missing. A commute without a file looks like a rest day, and your fitness line drops.
- One morning stands in for a trend. A single low HRV reading is noise until it repeats for several days.
- The number overrules the rider. Data should prompt a question, not end the conversation with your body or your coach.
Data cannot judge health. Pain that does not settle, unusual tiredness or illness belongs with a doctor or physio, whatever the chart says.
Further reading
- Does monitoring goal progress promote goal attainment? A meta-analysis of the experimental evidence, Harkin and colleagues, Psychological Bulletin, 2016.
- Effectiveness of wearable activity trackers to increase physical activity and improve health, Ferguson and colleagues, Lancet Digital Health, 2022.
- Monitoring the athlete training response: subjective self-reported measures trump commonly used objective measures, Saw, Main and Gastin, British Journal of Sports Medicine, 2016.
- Knowledge is power: issues of measuring training and performance in cycling, Passfield and colleagues, Journal of Sports Sciences, 2017.
- From data to decisions: how Lidl-Trek are using analytics to enhance rider performance, Lidl-Trek on Trek's racing website, 2024.
Velograph is not affiliated with, sponsored by or endorsed by any team, rider or company named in this article. Names are used only to refer to publicly reported work.