What research shows about saddle height, cranks, comfort and aero, how to test a fit change properly, and why one-session miracles rarely hold up.
The link between bike fit and power is real, but smaller than many riders hope. For a rider who already sits within a sensible range, lab studies of single changes such as saddle height or crank length find differences of a few percent at most. The bigger gains come from fixing a position that was clearly wrong, from comfort that lets you hold power for longer, and, on a time trial bike, from lower drag. The only way to know whether a fit helped you is to test before and after with the same protocol.
Does saddle height affect power?
Saddle height changes power by a few percent at most once the saddle is inside the range that suits the rider. It is the most studied part of the fit, and the evidence is clearer about what goes wrong than about a single perfect number.
Bini, Hume and Croft reviewed 62 papers in 2011. They found that the methods for setting saddle height varied and were not well established. Changes smaller than about 4% of the leg length measured to the hip (trochanteric length) did not seem to affect performance or injury risk. Larger changes did alter how the knee moved and how much it was loaded.
The studies comparing methods point the same way. These are the clearest results:
| Study | Riders | Comparison | Result |
|---|---|---|---|
| Peveler and Green, 2011 | 11 well-trained male cyclists | Knee bent 25 degrees vs 35 degrees vs 109% of inseam | At 25 degrees, oxygen use at the same workload was 2.6% lower than at 109% of inseam, and peak power in short maximal tests about 4% higher |
| Peveler, 2008 | 15 riders, cyclists and non-cyclists | The same three settings, 15 minutes at 70% of maximal oxygen uptake | Oxygen use lowest at a 25 degree knee angle |
| Ferrer-Roca and colleagues, 2012 | Well-trained cyclists | Inseam formula vs knee angle filmed while pedalling | 106 to 109% of inseam did not ensure a 30 to 40 degree knee bend; the authors proposed 108.6 to 110.4% |
Two lessons follow. A saddle set by formula alone is often outside the range that suits the rider: in Peveler and Green's study, 109% of inseam fell outside a 25 to 35 degree knee angle 73% of the time. And once the saddle is inside that range, the differences are a few percent, not double figures. Our article on saddle height compares the methods in detail.
Do crank length and seat angle affect power?
Crank length changes power less than intuition suggests, and seat angle changes how much energy a given power costs. Because the cost of crank length is small, many fitters now treat it as a comfort and hip-angle question.
Martin and Spirduso tested 16 trained cyclists on cranks from 120 to 220 mm. Maximal power ranged from 1,149 W on the 220 mm cranks to 1,194 W on the 145 mm cranks, a spread of under 4%. The authors concluded that the standard 170 mm crank should not substantially compromise maximal power in most adults.
Phil Burt, for 12 years lead physio at British Cycling, has written that he prescribes shorter cranks expecting comfort to improve without any loss of performance. A shorter crank lifts the knee less at the top of the stroke, which opens the hip, and that matters most in low positions.
For seat angle, Price and Donne had 14 competitive road cyclists ride at 200 W with seat tube angles of 68, 74 and 80 degrees. They used less oxygen, and so rode more efficiently, at 80 degrees than at 74, and at 74 than at 68. More efficient means the same watts cost less energy. A rider whose gross efficiency (the share of energy burned that reaches the pedals) rises from 20% to 20.4% gets 2% more power from the same energy.
Does a more comfortable bike fit add power?
A fit that removes discomfort adds usable power late in long rides, even if the lab numbers do not move. Most riders do not lose watts to a poor fit in a five-minute test. They lose them in the third hour, when they stand up every few minutes, shake out numb hands or ease off because the lower back aches.
Research supports the idea that position, comfort and perceived fatigue are linked. Priego Quesada and colleagues had 20 cyclists ride 45 minutes at half their peak aerobic power in three positions. The positions combined knee bends of 20, 30 and 40 degrees with trunk angles of 35, 45 and 55 degrees. A 40 degree knee bend (a low saddle) combined with a 35 degree trunk angle was rated the most uncomfortable. More knee bend brought more fatigue and more pain at the front of the thigh and knee. The most comfortable position kept the knee within the recommended range, with a more upright trunk.
That is why a long-ride check belongs in any fit evaluation. Power late in long rides, which coaches call durability, is where comfort shows up in the data. Pain that persists after a fit change is a reason to see your fitter again, and a doctor or physiotherapist if it does not settle.
Is a lower aero position faster if it costs power?
It can be. On a time trial or triathlon bike, a lower position can cost power and still be faster, because drag decides speed on flat roads. As a rule of thumb, it pays when the drag it saves, in percent, is clearly larger than the power it costs.
Fintelman and colleagues tested 19 well-trained cyclists at torso angles from 0 to 24 degrees: maximal values, peak power among them, fell as the torso went lower. Yet the lower position also cut frontal area.
For example, a position with 8% less drag pays as long as it costs less than about 7% of the power you can hold. Our guide to the time trial bike fit works through the numbers. Judge an aero change by speed at a given power, not by power alone.
How do you test whether a bike fit improved your power?
Repeat the same tests before and after the fit, change one thing at a time and use the same power meter. A single test on each side cannot show a gain of about 2%, because repeated power tests vary by about 0.9 to 2.0%.
Power tests are noisier than they feel. A review by Hopkins, Schabort and Hawley found that the typical variation between repeated constant-power tests lasting 1 minute to 3 hours was about 0.9 to 2.0%. Performance also improved by 1.2% from the first test to the second, as people learned the test, and the variation between those first two tests was larger than between later ones.
Here is what that means in practice. Say your 20-minute test was 280 W before a fit and 286 W after, a 2.1% gain. If your test varies by 1.5% from day to day, the difference between two single tests varies by about 2.1% (1.5% multiplied by the square root of 2). The gain is within the noise. It may be real, but one test each side cannot show it.
A sounder protocol uses several measures and repeats them:
| Test | How to run it | What it tells you |
|---|---|---|
| Steady ride at a fixed power | 20 minutes at the same watts, around 70 to 75% of FTP, same trainer, room, fan, time of day and cadence; average heart rate and perceived effort over the last 10 minutes | Whether the same power costs less. Read heart rate with care: see heart rate vs power |
| Maximal test | A 20-minute test, or the effort your event needs; one practice test first, then two in each position if you can | Whether you can produce more |
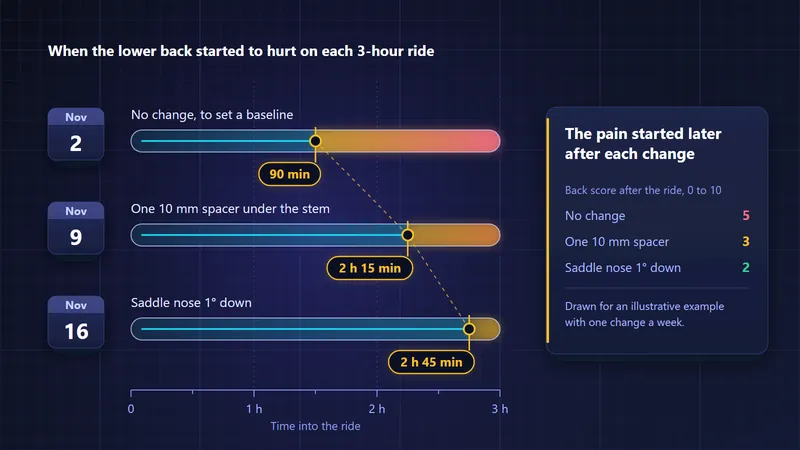
| Comfort log | Discomfort from 0 to 10 by body area, and how far into the ride it starts | Whether the fit lets you hold power longer |
| Outdoor check | A steady climb or a flat loop in similar weather, same tyres and pressures | Whether the change holds up on the road |
A few rules make the comparison fair. Change one thing at a time. Use the same power meter for every test and zero it (a zero offset, or calibration) before each ride. Test on days with similar training behind you, not straight after a rest week on one side and a hard block on the other. Give the body a few weeks to adapt to a new position before you judge it. In Velograph a fit is dated and kept with its bike, and your rides keep their power and heart rate, so the before and after are still there to compare next season.
Can one bike fit session give you a big jump in watts?
A fit rarely creates power, but it often protects the power you already have, over longer rides and in lower positions. Be sceptical when a single session promises a big jump in watts, and look for these warning signs.
- The gain is larger than the research. A claim of 20 W more at threshold from one saddle change is well beyond what controlled studies of single changes find.
- One test each side. As shown above, a 2% change from single tests sits inside normal day-to-day variation.
- Different power sources. A trainer's power before and a power meter's after cannot be compared.
- A rested rider after, a tired one before. Fatigue and freshness move test results more than most fit changes.
- Fast for ten minutes, painful for two hours. A position is only faster if you can hold it for your event.
- Everyone expected the new position to win. Expectation can change how hard you push, so judge on tests repeated over several days, not on one.
A good fit is still worth having, worth doing well and worth testing properly.
Further reading
- Effects of bicycle saddle height on knee injury risk and cycling performance, Sports Medicine, 2011.
- Effects of saddle height on economy and anaerobic power in well-trained cyclists, Journal of Strength and Conditioning Research, 2011.
- Determinants of maximal cycling power: crank length, pedaling rate and pedal speed, European Journal of Applied Physiology, 2001.
- Reliability of power in physical performance tests, Sports Medicine, 2001.
- Cycling biomechanics optimization: the (r)evolution of bicycle fitting, Current Sports Medicine Reports, 2019.
Velograph is not affiliated with, sponsored by or endorsed by any team, rider or company named in this article. Names are used only to refer to publicly reported work.