On flat roads, air is most of what slows you. What the hour record teaches about CdA, position and testing, and how to measure your own drag.
Cycling aerodynamics is about the air you push out of the way, and on flat roads at race speed it is most of what slows you down. At 40 km/h, around 85% of a rider's power goes into air resistance; tyres and drivetrain take the rest. Because the power needed to push air rises with the cube of speed, a small change in position can be worth as much as months of training. The hour record, ridden alone on a velodrome where almost every watt goes into air, shows this more clearly than any other event.
How much of your power goes into air resistance?
At 40 km/h on a flat road, around 85% of a rider's power goes into air resistance. Even at 30 km/h, the air takes about three quarters of it, and the share grows as you ride faster.
Two forces hold you back on a flat road: the air and the tyres' rolling resistance. Rolling resistance grows in step with speed. Air resistance grows with the square of speed, and the power to overcome it with the cube. Ride 10% faster and the air part of the bill rises by about a third.
The table shows the power an 80 kg rider and bike need on a flat road with no wind, in three positions. It uses the standard road-cycling power model with sea-level air, good road tyres and a little drivetrain loss.
| Speed | On the hoods (CdA 0.32) | In the drops (CdA 0.26) | Time-trial position (CdA 0.21) |
|---|---|---|---|
| 30 km/h | 143 W | 121 W | 103 W |
| 35 km/h | 216 W | 181 W | 153 W |
| 40 km/h | 312 W | 260 W | 217 W |
| 45 km/h | 433 W | 359 W | 298 W |
At 40 km/h, the air takes 84 to 88% of the power at the wheel, depending on the position. A review by Debraux and colleagues (2011) put it at about 90% for riders above 50 km/h. The lower the speed, the more rolling resistance matters, but even at 30 km/h air is about three quarters of the total.
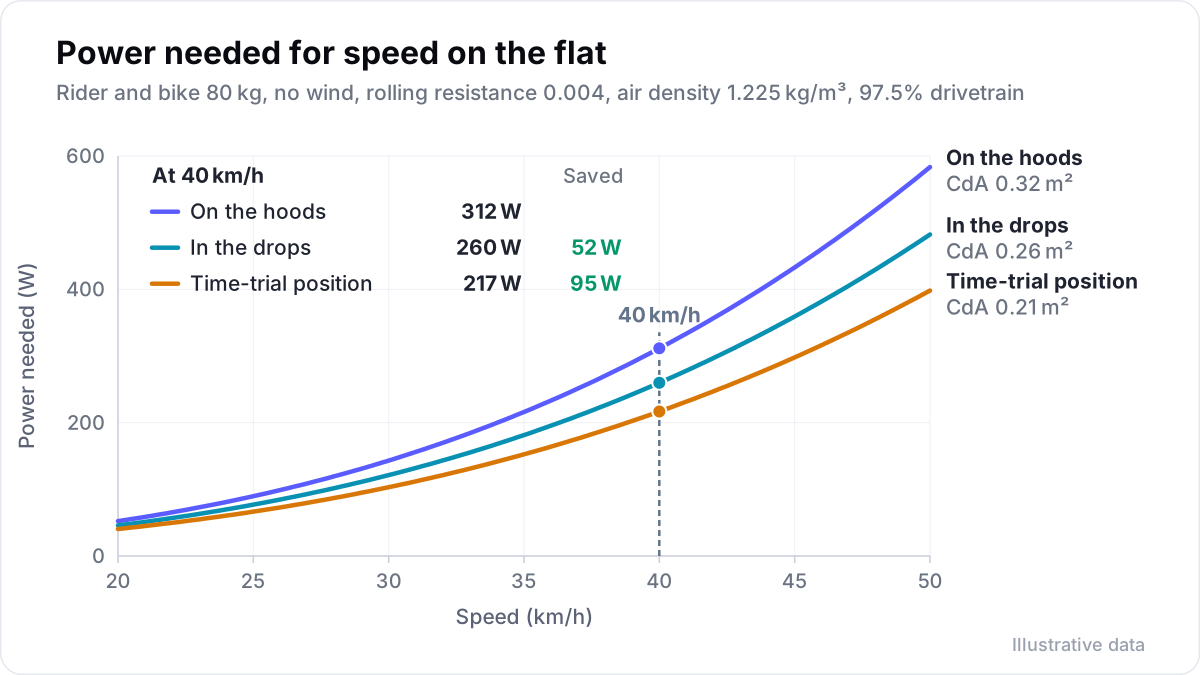
What is CdA in cycling?
CdA is your drag area: how big you are to the air (frontal area, A) multiplied by how cleanly the air flows around you (the drag coefficient, Cd). It is measured in square metres. Two riders with the same frontal area can have different CdA because of their shape, clothing and helmet.
The values in the table above are example values for an amateur; well-drilled time triallists go much lower.
CdA is useful because it turns aerodynamics into watts. At 40 km/h, lowering your CdA by 0.01 square metres saves about 8.6 W. At 30 km/h, the same change saves about 3.6 W. Faster riders save more watts from an aero change, but slower riders save more time, because they spend longer on the course:
| Power held over 40 km | Time saved by 0.01 m² less CdA |
|---|---|
| 200 W | about 48 seconds |
| 250 W | about 45 seconds |
| 300 W | about 42 seconds |
This is also why watts per kilo explains climbing but not flat roads. On the flat, what matters is power relative to drag, which is why heavier, more powerful riders often time trial well. Watts per kilo covers the climbing side.
What does the hour record teach about aerodynamics?
The hour record shows that small gains in speed are expensive. When nearly all power goes into air, riding 0.83% faster at the same power needs a CdA about 2.5% lower. It also shows that the air itself matters, that aero gains come from repeated measuring, and that a fast position only counts if you can hold it.
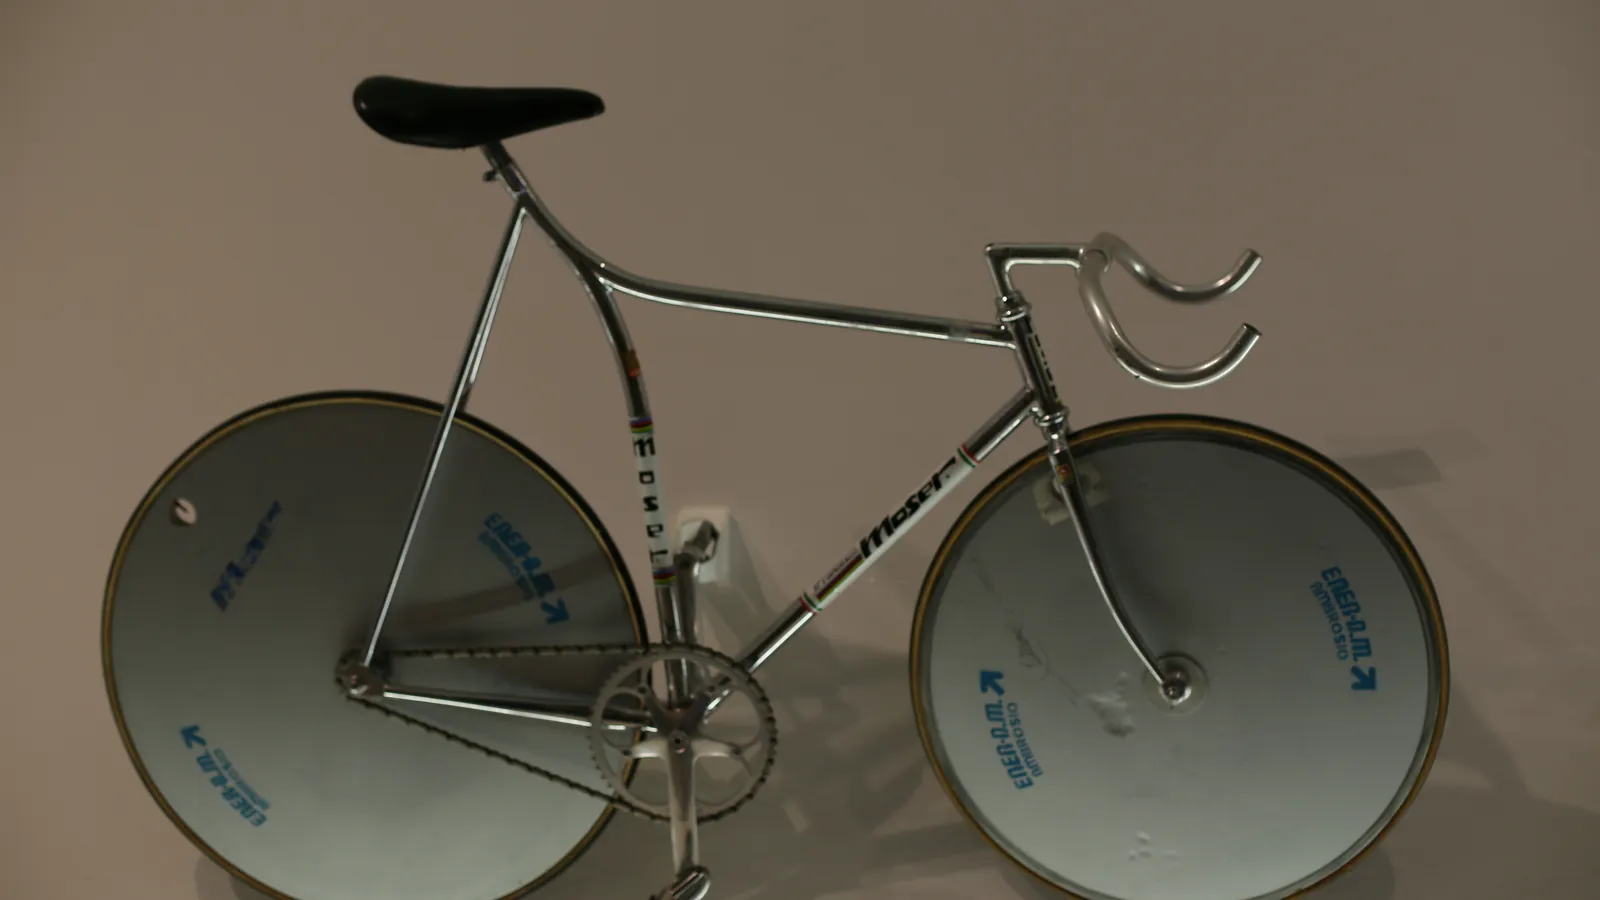
The UCI hour record is one rider, one hour, on a velodrome. There is no wind, no hill and no bunch, so the result depends on power, aerodynamics, rolling resistance and the air itself. These are the recent records:
| Year | Rider | Venue | Distance |
|---|---|---|---|
| 2015 | Bradley Wiggins | London, Lee Valley VeloPark | 54.526 km |
| 2019 | Victor Campenaerts | Aguascalientes, Mexico | 55.089 km |
| 2022 | Dan Bigham | Grenchen, Switzerland | 55.548 km |
| 2022 | Filippo Ganna | Grenchen, Switzerland | 56.792 km |
| 2023 | Vittoria Bussi | Aguascalientes, Mexico | 50.267 km |
| 2025 | Vittoria Bussi | Aguascalientes, Mexico | 50.455 km |
At the time of writing, Ganna's and Bussi's marks are the records. Four lessons stand out.
Margins are small, and the cube law makes them expensive
Bigham beat Campenaerts's distance by 459 metres, or 0.83%, the gain in speed that needs a CdA about 2.5% lower at the same power. Ganna's record is 4.2% further than Wiggins's. Under the same conditions, that gap would take roughly 13% more power, or a CdA about 11% lower, or a mix of the two. Speed is cheap to describe and expensive to buy.
The air itself matters
Denser air means more drag. When Wiggins set his record in London, his coach Heiko Salzwedel said the air pressure that evening was unusually high and feared it had cost distance, AFP reported. Both of Bussi's records and Campenaerts's were ridden at Aguascalientes, a velodrome at high altitude, where thinner air means less drag for the same power, though also less oxygen for the rider. When you compare your own test rides, note the temperature and air pressure: 3% denser air costs about 1% of speed on the flat.
Measure, then measure again
Bigham studied motorsport engineering and worked as a performance engineer at Ineos Grenadiers when he set his record. In 2024 he became head of engineering at Red Bull–Bora–hansgrohe. In a 2022 interview with the German magazine Tour, he said aero gains come from measuring air resistance more precisely, in the wind tunnel or on the velodrome, and from testing and refining again and again. He also said that lifting his head or leaving his position raised his air resistance by around 7%.
The position has to last
An hour record is ridden in one position for 60 minutes. A position that is a few watts faster but cannot be held, or costs power, is slower in practice. That trade-off is the heart of a good time trial bike fit.
Should you improve your position or your equipment first?
Work on your position first. The rider's body makes most of the drag, so the position is where most riders find the largest gains. Equipment comes after, and is easier to judge once the position is settled.
For most amateurs, this is the order to work in:
- Torso and head. A flatter back and a lower, steadier head. Bigham's 7% is a reminder that the head moves the number even when the rest of the position does not change.
- Arms and hands. Narrower hands and forearms that shield the chest, within what you can control and hold safely.
- Clothing. A close-fitting skinsuit or jersey. Flapping fabric costs watts at every speed.
- Helmet. The right helmet depends on how you hold your head. Test it in your own position.
- Wheels, frame and tyres. These bring real gains, and tyres also change rolling resistance. The gains are usually smaller than the first four, and easier to buy than to verify.
Every change has to be weighed against power and comfort. A lower front end that closes your hip angle may cost more watts than it saves. Test the position for the duration of your event, not for five minutes.
How can you do aero testing without a wind tunnel?
Most riders can test their aerodynamics in the field, with a power meter on a velodrome or a road loop. A wind tunnel is the most precise option and the least accessible.
Debraux and colleagues (2011) reviewed the methods and concluded that most field methods are inexpensive and give valid results compared with the wind tunnel, provided they are done carefully.
| Method | What you need | Good for |
|---|---|---|
| Velodrome laps at a fixed power | Track time, a power meter | Comparing positions and clothing in still air |
| Virtual elevation on a road loop | Power meter, speed sensor, elevation, software | Regular tests near home |
| Wind tunnel | A booking and a budget | Precise numbers and helmet choice |
The virtual elevation method
Robert Chung described a field method about twenty years ago that is still widely used. You ride a closed loop with a power meter. Software uses your power, speed, mass and assumed CdA and rolling resistance to rebuild the road's elevation from the energy balance. If the assumed values are right, every lap of the virtual elevation starts and ends at the same height, because a closed loop has no net climb. Adjust CdA and rolling resistance until the laps line up and you have your drag. Golden Cheetah, the free open-source analysis program, has a tool for it called Aerolab.
A practical protocol, based on Silca's guide written with Chung's input:
- Pick a loop of 30 seconds to five minutes that you can ride without braking, with no traffic.
- Choose a calm day and note the temperature and air pressure.
- Ride at least three laps per setup, ideally five or six, and vary your power as you go. Different speeds help separate air drag from rolling resistance.
- Hold the position exactly. Sitting up for a corner changes the number.
- Test in the order A, B, A, B, with the same tyres at the same pressure.
A worked example at the velodrome
On a track, keep power constant and compare speed. Say you ride several laps at 300 W in your usual position and average 45.0 km/h, then repeat in a new position and average 45.6 km/h. Because nearly all of the power goes into air, the speed ratio cubed gives the drag ratio: (45.6 ÷ 45.0)³ is about 1.04, so the new position has roughly 4% less CdA. Repeat both positions to make sure the difference is larger than the spread between your runs. In Velograph, dragging across a stretch of a ride shows its average power and speed, which makes comparing runs quick.
Then take the faster position on the road, ride it at race effort for the length of your event, and check that your power holds. Aerodynamics wins time only if you can hold the position and the power together. Your time trial pacing plan should assume the position you can sustain, not the one you tested for a few laps. As the story of marginal gains shows, the gain only counts once you have measured it.
Further reading
- Aerodynamic drag in cycling: methods of assessment, Debraux and colleagues, Sports Biomechanics, 2011.
- Validation of a mathematical model for road cycling power, Martin and colleagues, Journal of Applied Biomechanics, 1998.
- Daniel Bigham breaks the UCI Hour Record, UCI, 2022.
- Vittoria Bussi beats her own UCI Hour Record, UCI, 2025.
Velograph is not affiliated with, sponsored by or endorsed by any team, rider or company named in this article. Names are used only to refer to publicly reported work.