Banister's TRIMP, Edwards' zones, Lucia's thresholds and the individual version, worked through one ride, and how each compares with session RPE and power.
TRIMP, short for training impulse, turns the duration and heart rate of a session into one training load score, and it counts a hard minute for more than an easy one. Eric Banister's original weights each minute by its share of the range between resting and maximum heart rate. Later versions count minutes in heart-rate zones, or weight them by the rider's own lactate test. In a 2017 study of 15 well-trained road cyclists, the versions built on each rider's own physiology tracked fitness gains most closely. TRIMP needs no power meter and works in any sport with a heart-rate strap, but it misses short efforts and rises in the heat.
What is TRIMP in training?
TRIMP is a training load score that multiplies the minutes of a session by a heart-rate weighting, so that harder minutes count for more. Banister and colleagues proposed it in 1975 as the input to their fitness-fatigue model. Its units are arbitrary, so a score compares only with scores from the same method.
Minutes alone overrate a long easy ride, and heart rate alone ignores how long an effort lasted. TRIMP combines the two, and the daily totals can feed the fitness, fatigue and form lines in our guide to training load, fitness and fatigue. Four versions are common: Banister's curve, Edwards' five zones, Lucia's three zones and an individualised version built on a lactate test.
How do you calculate Banister's TRIMP?
Multiply the minutes by the heart-rate reserve fraction and by a weighting of 0.64 × e^(1.92 × fraction) for men, or 0.86 × e^(1.67 × fraction) for women. The fraction is exercise heart rate minus resting heart rate, divided by maximum minus resting.
TRIMP = minutes × HRR × 0.64 × e^(1.92 × HRR)
HRR is that fraction, the share of your heart-rate range the session used. The weighting is exponential because blood lactate climbs steeply, not in a straight line, as heart rate rises. The women's curve starts a little higher and rises a little less steeply. We found the women's constants in a 2013 study by Tabben and colleagues, who credit them to a 1991 chapter by Banister.
A worked example: a man with a resting heart rate of 50 and a maximum of 190 rides for 60 minutes at an average of 150 beats per minute.
- Heart-rate reserve: (150 − 50) ÷ (190 − 50) = 0.714.
- Weighting: 0.64 × e^(1.92 × 0.714) = 0.64 × 3.94 = 2.52.
- TRIMP: 60 × 0.714 × 2.52 = 108.
A woman with the same heart rates would score 121. One minute earns:
| Heart-rate reserve | Heart rate | Points per minute, men | Points per minute, women |
|---|---|---|---|
| 50% | 120 bpm | 0.84 | 0.99 |
| 70% | 148 bpm | 1.72 | 1.94 |
| 80% | 162 bpm | 2.38 | 2.62 |
| 90% | 176 bpm | 3.24 | 3.48 |
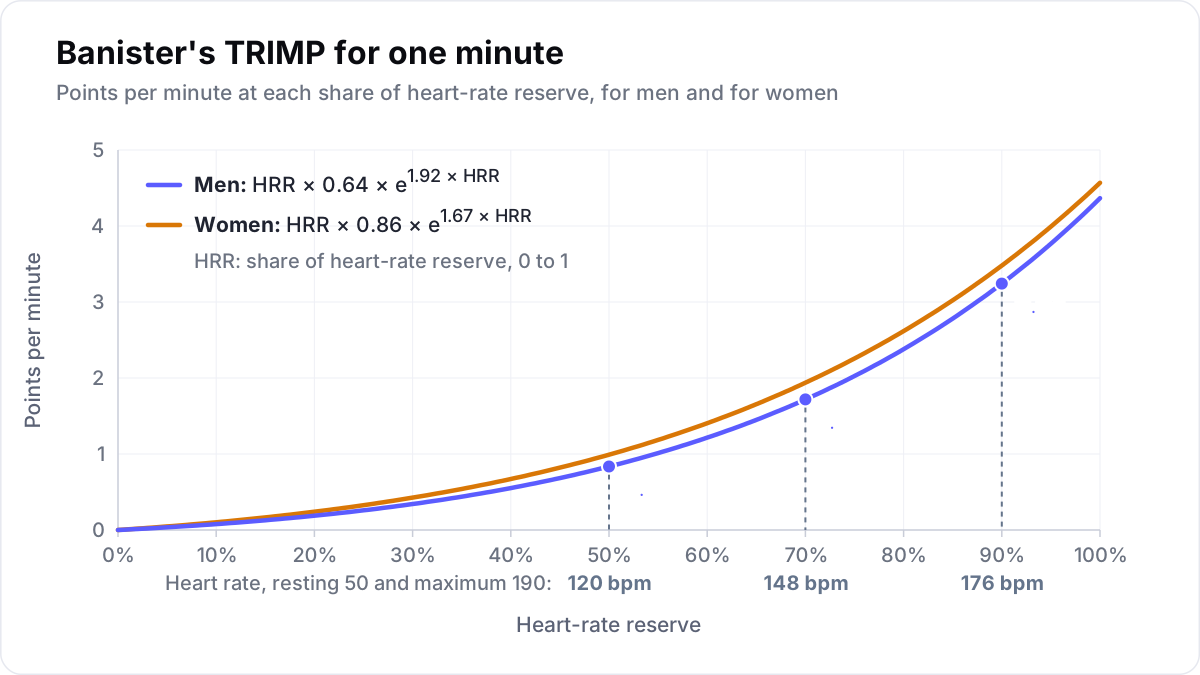
So 90 minutes at 130 beats per minute scores 99, close to the 108 of the harder hour.
Should TRIMP use average heart rate or every second?
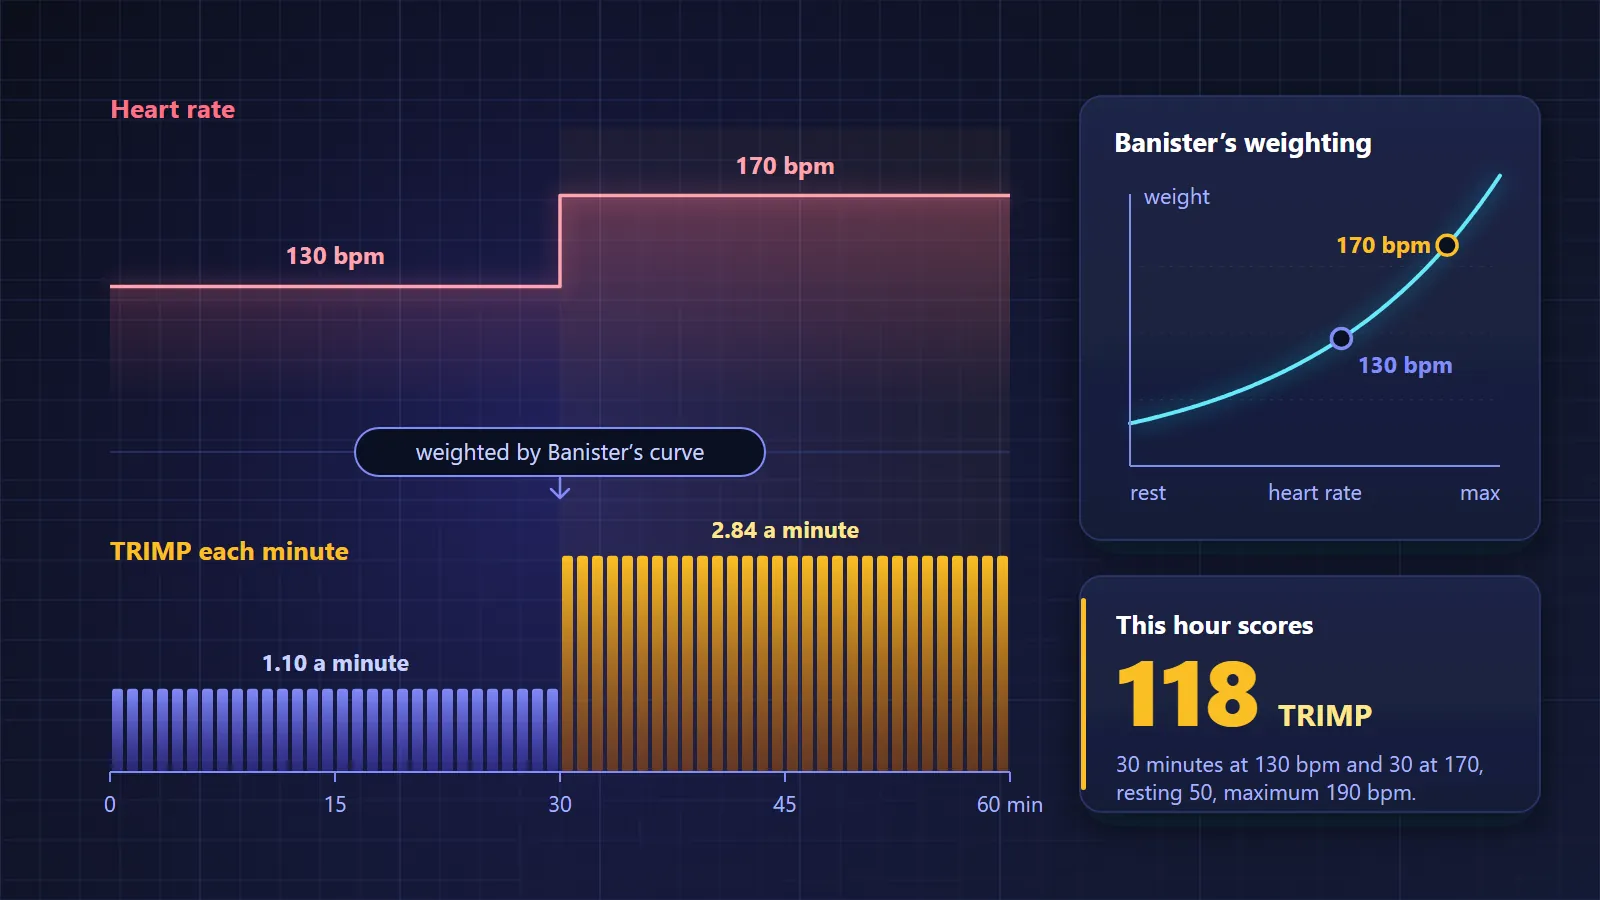
Pick one method and keep it, because the two give different scores for the same ride. Banister's formula uses the average heart rate of the session. Applied to every second and added up, it scores higher on any ride where heart rate varies, because high heart rates gain more than low ones lose.
Take an hour of 30 minutes at 130 beats per minute and 30 at 170. It averages 150, like the steady hour above, and from that average it scores 108. Scored minute by minute it reaches 118, about 9% more.
What are Edwards' and Lucia's TRIMP?
Edwards' and Lucia's methods are zone versions of TRIMP: you add up the minutes in each heart-rate zone, each multiplied by a fixed weight. Edwards uses five zones of maximum heart rate, weighted 1 to 5. Lucia uses three zones split at two thresholds from a lab test, weighted 1 to 3.
Edwards' zones, published in 1993, run from 50 to 59% of maximum heart rate (weight 1) up to 90 to 100% (weight 5), in steps of ten points, and minutes below 50% do not count. Alejandro Lucia and colleagues split their zones at the ventilatory threshold and the respiratory compensation point from a ramp test. In 2003 they scored seven professionals who had ridden both the Tour de France and the Vuelta a España: the Tour took more riding time, but the total loads did not differ.
What is individualised TRIMP?
Individualised TRIMP weights every heart-rate reading by the rider's own curve of blood lactate against heart rate, measured in a lab, instead of a curve shared by all men or all women. Manzi and colleagues proposed it in 2009 for distance runners. The curve shifts as fitness changes, so the test needs repeating now and then.
Which training load measure tracks cycling fitness best?
In a 2017 study of 15 well-trained road cyclists, the measures built on each rider's own physiology tracked fitness gains most closely: individualised TRIMP and power-based load against FTP. Banister's TRIMP and session RPE showed the weakest links, although every measure was related to the gains.
Dajo Sanders and colleagues followed 15 male riders from Dutch club and UCI teams through 728 sessions in 10 weeks of winter training. Their power at a blood lactate of 2 mmol/L, a steady endurance effort, rose by about 7%. The link between each rider's total load and their gain is given as r, from 0 for none to 1 for a perfect one.
- Power at 2 mmol/L: individualised TRIMP had the closest link (0.81), then power-based load (0.75). Session RPE (0.54) and Banister's TRIMP (0.52) were the weakest.
- An 8-minute time trial: Lucia's TRIMP (0.70) and individualised TRIMP (0.63) had the closest links.
- VO2max: no method was clearly linked to its change.
The scales differ widely. The riders' average week scored about 1,090 in Banister's TRIMP, 2,142 in Edwards', 4,086 in session RPE and 729 in power-based load. With 15 riders over one winter, read the ranking as a guide.
How does TRIMP compare with session RPE and power-based load?
TRIMP measures what a session cost your heart and lungs. Session RPE measures what it cost you as a whole, and power-based load measures the work you did against your FTP. Each needs different inputs and uses its own scale.
Take one 90-minute ride by a man with a resting heart rate of 50, a maximum of 190, lab thresholds at 145 and 167 beats per minute and an FTP of 280 W. He spent 15 minutes around 118 beats per minute, 35 around 132, 25 around 146, 12 around 160 and 3 around 176, an average of 139. His normalized watts were 210, and he rated the ride 5 out of 10.
| Method | What it used | Score |
|---|---|---|
| Banister, from the average | 90 minutes at 139 bpm | 123 |
| Banister, minute by minute | The five blocks of heart rate | 130 |
| Edwards | Minutes in five zones of maximum heart rate | 238 |
| Lucia | Minutes below, between and above the thresholds | 133 |
| Session RPE | 90 minutes × a rating of 5 | 450 |
| Power-based load | Normalized watts of 210 against an FTP of 280 | 84 |
The power-based score uses the scale of TrainingPeaks' Training Stress Score (TSS), where an hour at FTP scores 100. Session RPE is Carl Foster's method from 2001: the rider rates the whole session from 0 to 10 after it ends, and the rating is multiplied by the minutes. Foster found it kept a consistent relationship with a heart-rate method in cycling and basketball, and our guide to cycling training data explains how to use it.
| Heart-rate TRIMP | Session RPE | Power-based load | |
|---|---|---|---|
| Measures | Strain on heart and lungs | The session as you felt it | Work against your threshold |
| Needs | A chest strap and correct heart rates | A rating after every session | A power meter and a current FTP |
| Sprints and surges | Counted low, as heart rate lags | Counted if you felt them | Counted in full |
| Other sports | Anything with heart rate | Everything, the gym included | Rides only |
Velograph does not compute TRIMP. Its training load uses power against FTP when a ride has power and heart rate against threshold heart rate when it has none, both scaled so an hour at threshold scores 100. A session with only an effort rating gets a rough load from its duration and the rating. See what a rider gets on their own.
Which training load should juniors and clubs use?
Session RPE is the practical choice for juniors and clubs, because it needs no sensor and covers every session, from gym work to runs. Add heart-rate TRIMP for riders with a chest strap and a measured maximum heart rate, and power-based load for riders with power meters, each compared only with itself.
Power-based load cannot score riders without power, nor a run or a gym session, while session RPE gives every rider one number per session on one scale. Our guides to junior cycling training and cycling club training start with it. If you add heart-rate TRIMP, set it up with care:
- Resting heart rate: measure it lying down after waking, as the average of a few mornings.
- Maximum heart rate: use the highest value from a hard race or an all-out test in the last year, not a figure estimated from age.
- One method: choose a version, and average or second by second, and keep to it with one strap.
- A yearly check: update both heart rates each season and after a long break.
Compare each rider with their own recent weeks, never with a teammate's total.
What can TRIMP not see?
TRIMP cannot see short hard efforts, because heart rate lags behind them, and it scores higher in the heat, with dehydration and with illness, because heart rate rises for the same work. It also misses most of the effort in strength sessions.
- Sprints. Six 15-second sprints barely move average heart rate. Our guide to heart rate vs power explains the lag and the drift.
- Races. In nine riders' files from the 2016 Giro d'Italia, Sanders and Heijboer scored mountain stages at 329 on power-based load and 359 on TRIMP, and flat stages at 217 and 298. On power the mountains were 52% harder, on heart rate only 20%.
- Wrong inputs. TRIMP depends on correct heart rates: a maximum set 10 beats too low pushes every session up the curve.
Sanders and colleagues suggested pairing session RPE with a heart-rate measure, because the two can drift apart when a rider is tired. When the rating says hard and heart rate says easy, ask why.
Further reading
- Methods of monitoring training load and their relationships to changes in fitness and performance in competitive road cyclists, Sanders and colleagues, International Journal of Sports Physiology and Performance, 2017.
- A new approach to monitoring exercise training, Foster and colleagues, Journal of Strength and Conditioning Research, 2001.
- Tour de France versus Vuelta a España: which is harder?, Lucia and colleagues, Medicine and Science in Sports and Exercise, 2003.
- Session-RPE method for training load monitoring, Haddad and colleagues, Frontiers in Neuroscience, 2017.
Velograph is not affiliated with, sponsored by or endorsed by any team, rider or company named in this article. Names are used only to refer to publicly reported work.