How many watts pro cyclists produce on climbs, in sprints and over a whole stage, from peer-reviewed team data, and how to compare your own numbers fairly.
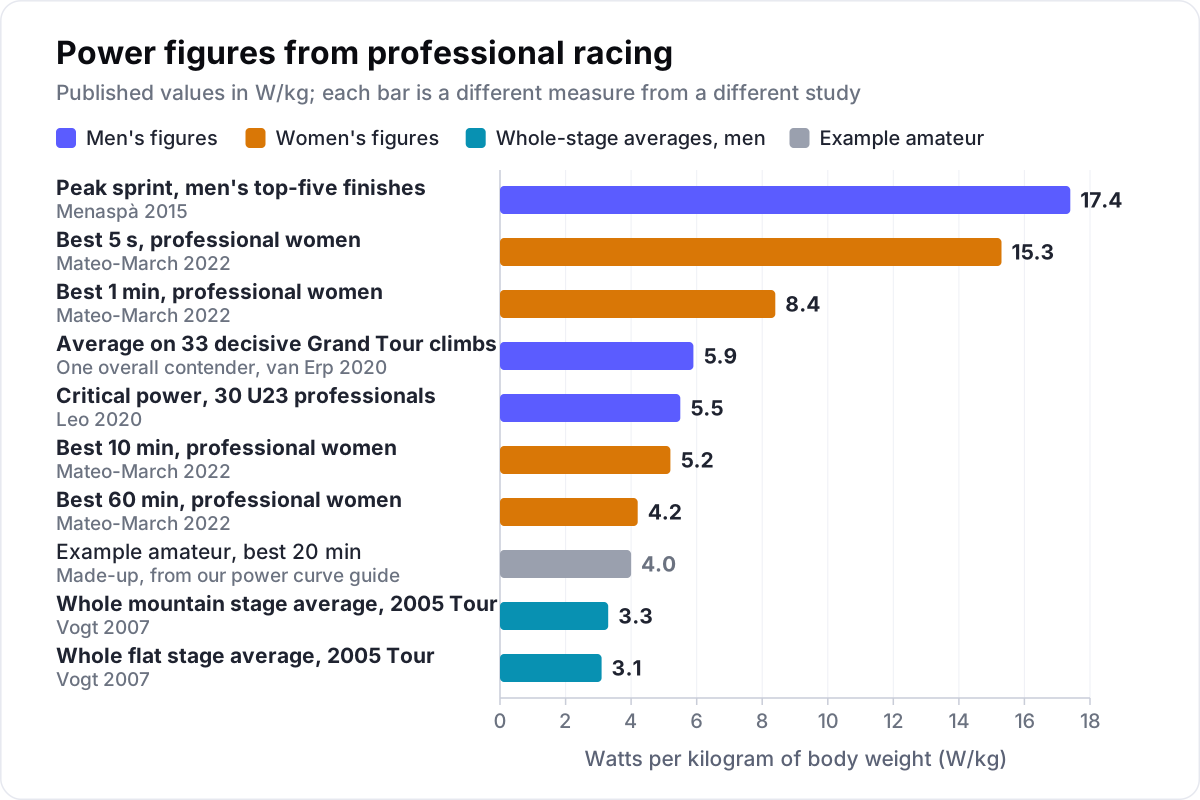
Pro cyclist power output depends on which effort you ask about. Over a whole Tour de France stage, riders studied in the 2005 race averaged only 218 to 234 W, about 3.1 to 3.3 W/kg. On the decisive climbs of four Grand Tours, one rider racing for the overall win averaged 5.9 W/kg. Male sprinters peaked at 17.4 W/kg in top-five finishes, and professional women held 4.2 W/kg on average for their best hour. In one large study, WorldTour riders stood out from the division below by the power they kept after hours of racing.
How many watts do pro cyclists produce?
In the 2005 Tour de France, professional men averaged about 220 to 235 W over a whole stage, but close to 400 W for their best half hour of a mountain stage. Male sprinters averaged nearly 500 W in the last minute before a sprint, and women's sprint finishes averaged about 680 W for 22 seconds.
Every figure here comes from power files that teams or riders gave to researchers, not from estimates made from television pictures.
| Effort | Published figure | Riders | Study |
|---|---|---|---|
| A whole flat stage, average | 218 W (3.1 W/kg) | 15 men, 2005 Tour de France | Vogt and colleagues, 2007 |
| A whole mountain stage, average | 234 W (3.3 W/kg) | The same riders | Vogt and colleagues, 2007 |
| Best 30 minutes of a mountain stage | 394 W | The same riders | Vogt and colleagues, 2007 |
| Last 10 minutes before a sprint | 316 W | 6 men, 17 top-five sprint finishes | Menaspà and colleagues, 2015 |
| Last minute before a sprint | 487 W | The same riders | Menaspà and colleagues, 2015 |
| A sprint finish | 679 W for 21.8 s, peak 886 W | 7 women, 31 top-five finishes | Peiffer and colleagues, 2018 |
Men's and women's races ask for different things. In a 2019 study of 3,024 men's and 667 women's race files from professional riders, men's races were longer, with more total work and higher average power. Women's races had more time in the two highest heart-rate zones and more load for each kilometre raced.
What W/kg do pro cyclists hold on climbs?
On the decisive climbs of the Grand Tours, one rider racing for the overall win averaged 5.9 W/kg across 33 climbs in four races. His power was lower on longer climbs and after more climbing earlier in the stage, and higher on steeper climbs.
Teun van Erp and colleagues published this case in 2020, with the rider's files from the 2015 Vuelta a España, the Giro d'Italia of 2017 and 2018 and the 2018 Tour de France. The paper does not name the rider.
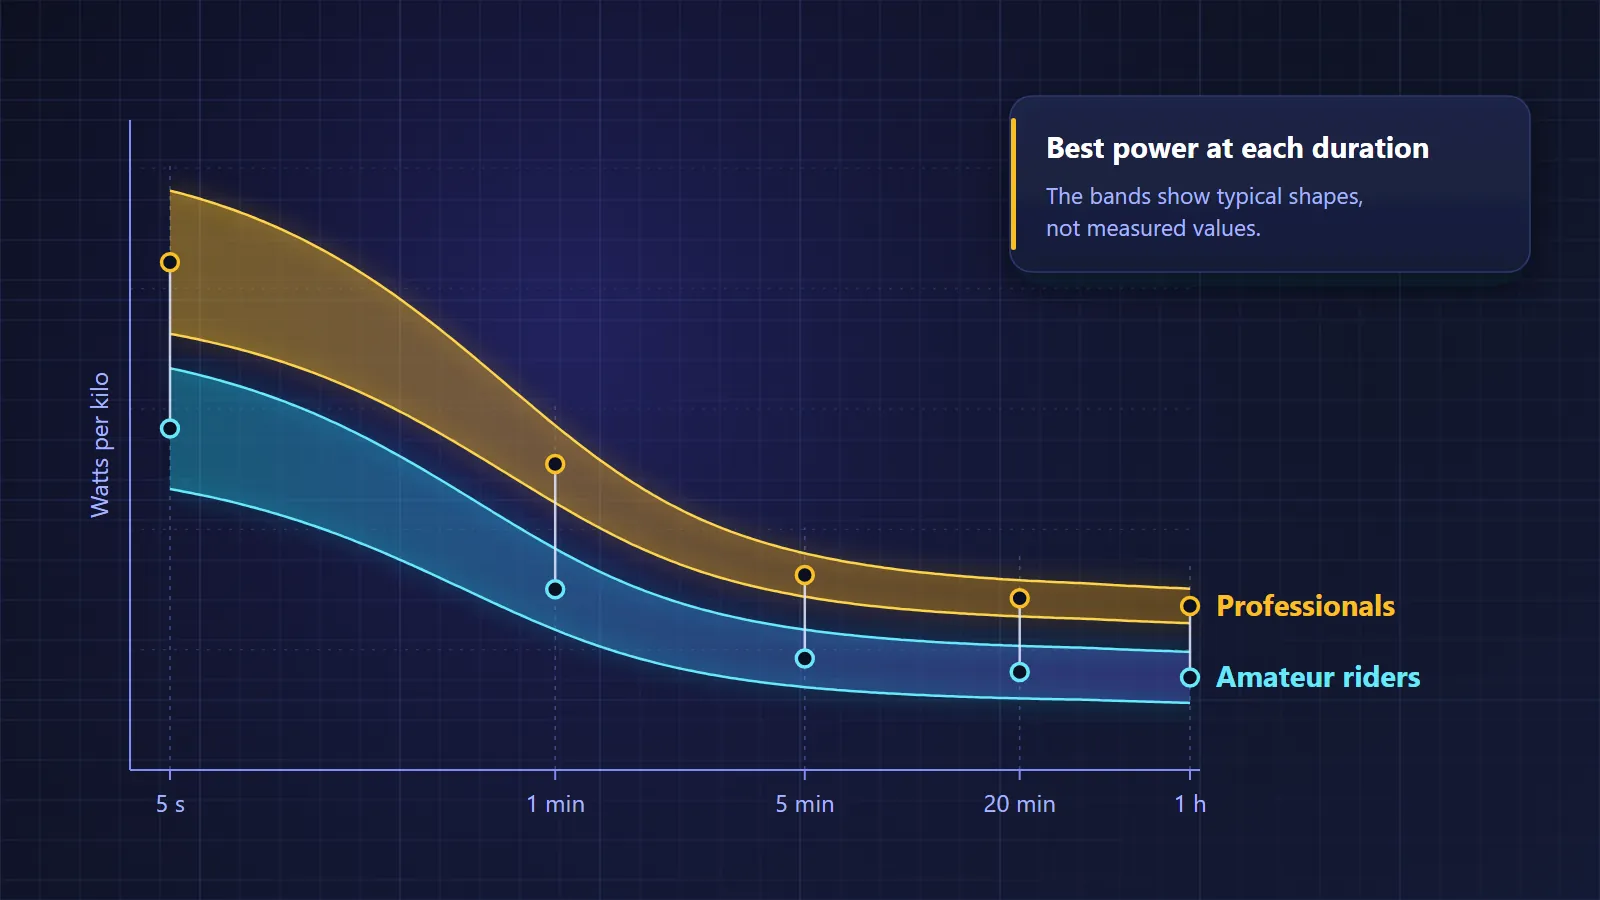
Rider type and level both matter. Pedro Valenzuela and colleagues pooled 129,262 files from 144 men on four professional teams over eight years. Riders racing for the overall classification had the highest W/kg from 1 minute to 4 hours. WorldTour riders had higher W/kg than riders one division below at 1 second, 60 minutes and 4 hours, and more absolute watts for every effort of 5 minutes or longer. The riders one division below had more W/kg over 30 to 60 seconds. Among professional women, the time triallists had the highest W/kg from 10 to 60 minutes.
What does 2 W/kg more mean on the road? By the physics in our guide to watts per kilo, a 75 kg rider needs about 36 minutes 49 seconds for 10 km at 7% at 4 W/kg, and about 26 minutes 13 seconds at 6 W/kg.
How hard is a pro sprint finish?
A professional sprint finish ends a long build-up: in 17 top-five finishes, male professionals averaged 316 W over the last 10 minutes and 487 W in the final minute, then peaked at 17.4 W/kg in the sprint itself. Women's sprint finishes lasted about 22 seconds at 679 W on average.
Paolo Menaspà and colleagues recorded the six men's speed as well: 50.5 km/h over the last 10 minutes and 55.4 km/h in the last minute. For a 72 kg rider, close to these riders' average weight, 17.4 W/kg is about 1,250 W. The women in Jeremiah Peiffer's study peaked at 886 W and averaged 679 W over about 22 seconds.
The lesson for anyone training a sprint is that the peak is the last few seconds of a long, hard effort. A fresh 5-second test on a trainer measures only the end of it.
Why does a stage's average power say so little?
A stage average mixes hours of sheltered riding and freewheeling with a few minutes of very hard work, so it hides the efforts that decide the race. In the 2005 Tour de France, flat and mountain stages averaged within 16 W of each other, yet the riders' best 30 minutes on mountain stages were 52 W higher.
Normalized watts estimate the steady power that would have cost the body the same, giving surges extra weight. Take a made-up flat stage for a 70 kg rider: 90 minutes in the bunch with a third of the time freewheeling, two steady hours, 45 minutes of chasing in 20-second surges, and a fast final 15 minutes with a sprint.
| Made-up flat stage, 4 hours 30 minutes | Value |
|---|---|
| Average power | 213 W (3.0 W/kg) |
| Normalized watts | 257 W (3.7 W/kg) |
| Work done | 3,457 kJ, about 49 kJ per kilo |
| Best 15 seconds | 1,150 W |
In W/kg, the average is below the best hour of the example amateur in our power curve guide. The stage is hard because of the surges, the sprint and the work done before them. Sanders and Heijboer found that professionals spent most of the mass-start stages of a Grand Tour at low intensity, and our article on how pro cycling teams use data describes what each stage type asks for. In the 2020 Vuelta, WorldTour riders spent more time above 5.25 W/kg than riders one division below.
What is a pro cyclist's FTP?
The studies of professional riders here report critical power, lab thresholds and best efforts rather than FTP. Thirty U23 professionals had an average critical power of 382 W, or 5.5 W/kg, and professional women held 4.2 W/kg on average for their best 60 minutes.
The U23 riders, from a UCI continental development team, also averaged a VO2max of 73.7 ml per kilo per minute. Critical power is close to FTP but not the same number, as our comparison of critical power and FTP explains.
The women's figures come from Mateo-March and colleagues, who analysed 32,028 files from 44 professionals. Their best efforts averaged 15.3 W/kg for 5 seconds, 8.4 W/kg for 1 minute, 5.2 W/kg for 10 minutes and 4.2 W/kg for 60 minutes.
A step below, the 15 well-trained riders from Dutch club and UCI teams in Dajo Sanders' 2017 study averaged 5.15 W/kg in an 8-minute time trial. By the study's rule of 90% of that, their FTP was about 4.6 W/kg. Our guide to what FTP is explains how to test your own.
How much power do pros keep after hours of racing?
In a study of 112 professional men, best power fell by about 2 to 3% after roughly 80 minutes of racing and by 6 to 10% after about four hours. WorldTour riders lost less than riders one division below, and the gap grew as the race went on.
Researchers measure the work done in kilojoules per kilo of body weight. Mateo-March and colleagues compared best efforts from 10 seconds to 2 hours, fresh and after 15, 25, 35 and 45 kJ per kilo. At a typical stage pace of about 3.2 W/kg, 15 kJ per kilo takes about 80 minutes and 45 kJ per kilo about four hours.
| Riders | After about 80 minutes | After about 4 hours |
|---|---|---|
| WorldTour | 1.8 to 2.9% lower | 4.7 to 8.8% lower |
| One division below | 1.1 to 4.4% lower | 7.6 to 11.6% lower |
Fresh, the two groups did not differ in any consistent way. Late in a race, the WorldTour riders had more power, most of all for efforts of 5 minutes or longer. That late power is durability, and in this study it separated the two divisions better than fresh power did.
How do you compare your power with the pros fairly?
Compare W/kg at the same durations, from genuine all-out efforts, and compare a fresh number with a fresh number and a late one with a late one. A stage average, an FTP and a sprint peak are different measures, so set each of yours beside the matching professional figure.
The example amateur road rider in our power curve guide weighs 72 kg and holds 4.0 W/kg for 20 minutes and 3.7 W/kg for an hour. That is still short of the professional women's average hour of 4.2 W/kg. A few rules keep the comparison honest:
- Use the same durations: 5 seconds, 1 minute, 5 minutes, 20 minutes and an hour.
- Use only all-out efforts. A duration you have not ridden hard looks weak without being weak.
- Use one steady weight figure, not this morning's reading.
- Compare race with race. In a 2020 study, U23 professionals' best 2 to 12-minute power was higher in races than in training.
- Look at late efforts. Your best 5 minutes after two hours tells you more than your fresh best.
- Compare with yourself most of all. Your own curve this season against last is the comparison that changes your training.
Velograph shows your power curve and, for every ride with power once your weight is entered, your best efforts after each level of work. The free Rider plan keeps your rides with ride analysis and has no end date; see what a rider gets on their own.
Further reading
- Power output during the Tour de France, Vogt and colleagues, International Journal of Sports Medicine, 2007.
- Case report: load, intensity, and performance characteristics in multiple grand tours, van Erp and colleagues, Medicine and Science in Sports and Exercise, 2020.
- The record power profile of male professional cyclists: normative values obtained from a large database, Valenzuela and colleagues, International Journal of Sports Physiology and Performance, 2022.
- The record power profile in professional female cyclists: normative values obtained from a large database, Mateo-March and colleagues, International Journal of Sports Physiology and Performance, 2022.
- The record power profile of male professional cyclists: fatigue matters, Mateo-March and colleagues, International Journal of Sports Physiology and Performance, 2022.
Velograph is not affiliated with, sponsored by or endorsed by any team, rider or company named in this article. Names are used only to refer to publicly reported work.