How many watts does an average cyclist produce? What studies measured, how freewheeling and normalized watts change the number, and what club rides ask.
Searches for average watts cycling usually ask one of two questions: what a ride averages, and what a typical rider can hold. The first depends on speed, wind, drafting and freewheeling: on a flat road, 30 km/h alone takes about 143 W for a rider and bike of 80 kg, and a club ride often averages far less than it felt. The second has no reliable answer, because no study has measured a random sample of cyclists. Small peer-reviewed samples put untrained young men at about 190 W for 40 minutes and trained male cyclists at about 300 W in time trials of about an hour.
What are average watts in cycling?
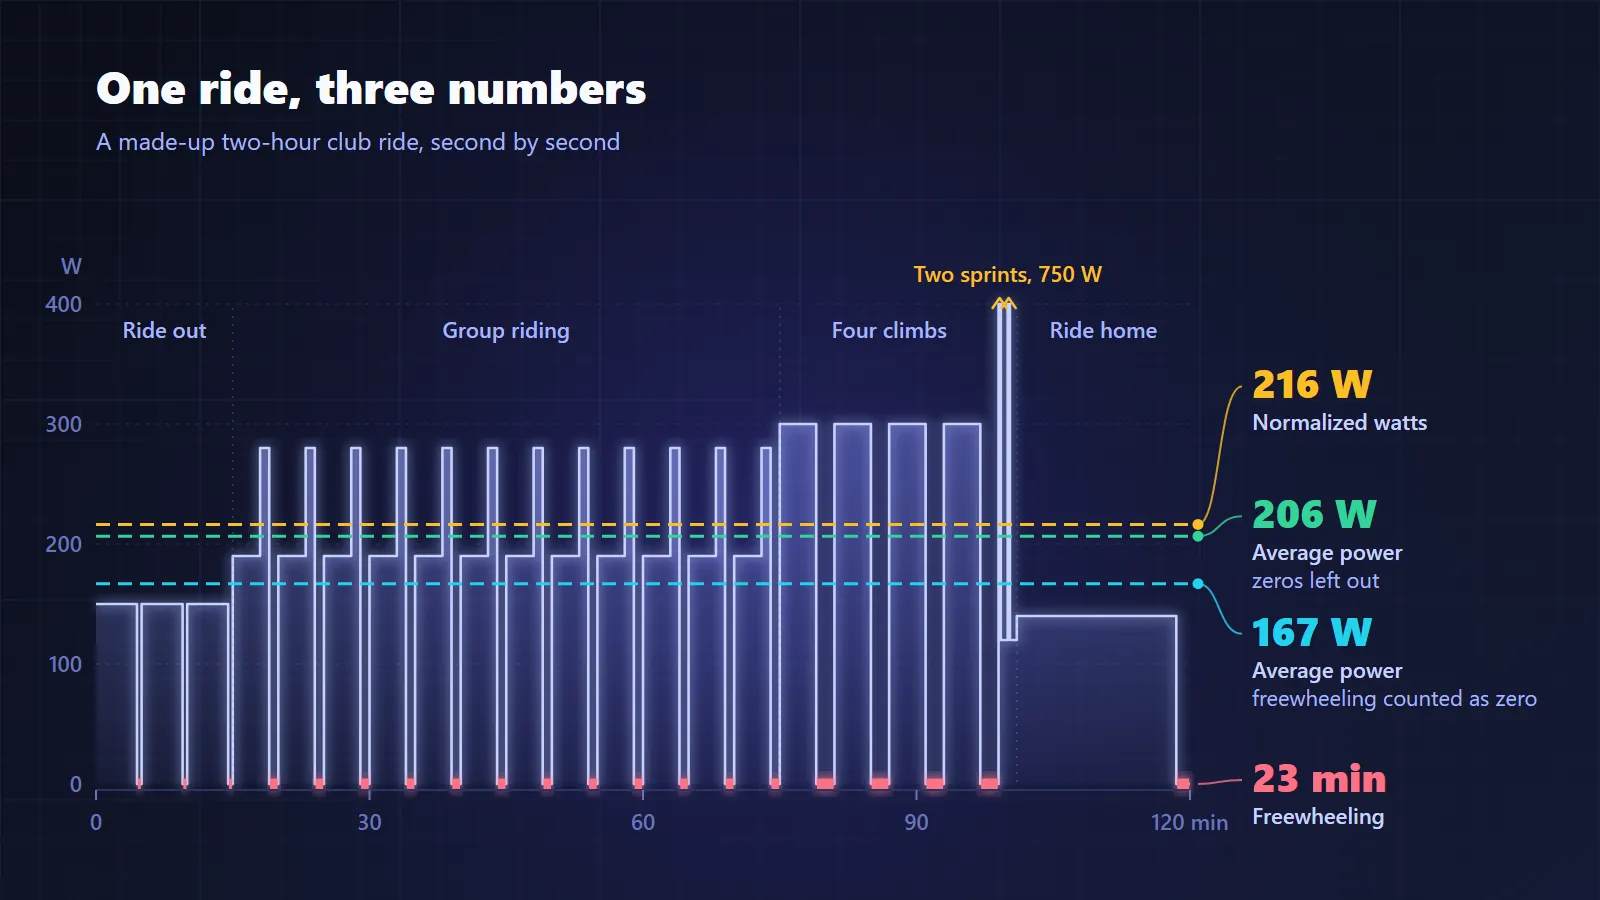
Average watts, or average power, is your total work divided by the time it took: the mean of every power reading in the ride. Whether freewheeling counts as zero changes it a lot. In a made-up two-hour club ride with 19% freewheeling, it is 167 W with zeros and 206 W without.
A power meter usually records one reading a second. Every second you freewheel, it reads zero. A ride with long descents, traffic lights and time on a wheel has many zeros, so its average falls well below what the riding felt like.
Here is the made-up ride, for a rider with an FTP of 250 W:
| Part | Time | What the rider does |
|---|---|---|
| Ride out | 15 min | 150 W, with 1 min 30 s of freewheeling |
| Group riding | 60 min | 12 rounds of 3 minutes sheltered at 190 W, 1 minute on the front at 280 W and 1 minute freewheeling |
| Four climbs | 24 min | 4 minutes at 300 W, then 2 minutes freewheeling down |
| Two town-sign sprints | 2 min | 15 seconds at 750 W, then 45 seconds easy |
| Ride home | 19 min | 140 W, with 1 min 30 s of freewheeling |
| Figure | Value | For a 75 kg rider |
|---|---|---|
| Average power, freewheeling counted as zero | 167 W | 2.2 W/kg |
| Average power, zeros left out | 206 W | 2.8 W/kg |
| Normalized watts | 216 W | 2.9 W/kg |
| Work done | 1,202 kJ | |
| Time freewheeling | 23 minutes | 19% of the ride |
The same ride gives three numbers that differ by almost 50 W. None is wrong; each answers a different question.
Should average power include zeros?
Include zeros when you want the true average of the work you did, because freewheeling is part of the ride. Garmin's Edge 850 manual, for example, says its default leaves the zeros out, so check the setting before you compare devices and apps.
On the Edge 850 the setting is called Power Averaging, under System, then Data Recording. Velograph's ride page counts freewheeling as zero and says so beside the number. Either choice is fine for your own records, as long as you keep it. Otherwise a gap like the example ride's 24% can look like fitness.
What is the difference between average and normalized watts?
Average power tells you how much work you did, while normalized watts estimate the steady power that would have been just as hard. The more you surge and freewheel, the further normalized watts rise above the average: 216 W against 167 W in the example ride.
Normalized watts are worked out from a 30-second rolling average of power, raised to the fourth power, averaged and brought back with a fourth root. The fourth power gives hard surges far more weight than easy riding. A steady hour on a trainer has normalized watts close to its average. A ride full of surges and freewheeling can have normalized watts 30% above its average, as the example ride does.
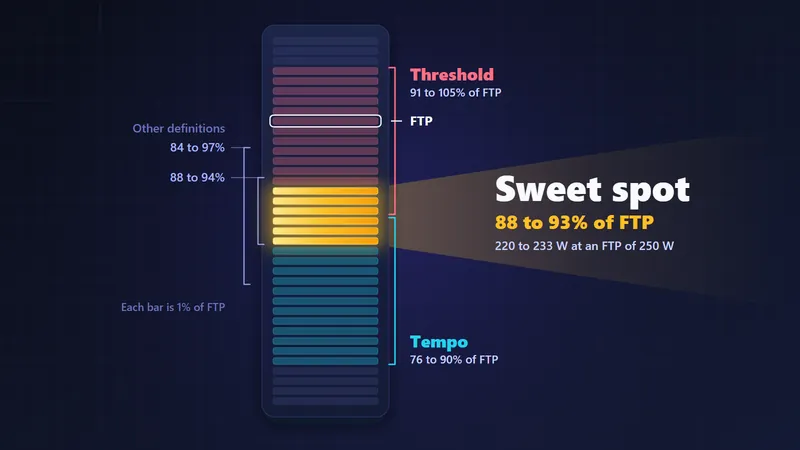
Use each for its own job. Average power and kilojoules say how much work you did. Normalized watts say how hard the ride was for the body, which matters for recovery. Neither is your FTP, the number your training zones are set from, and an easy club ride's average says almost nothing about what you could hold in a hard hour.
How many watts does an average cyclist produce?
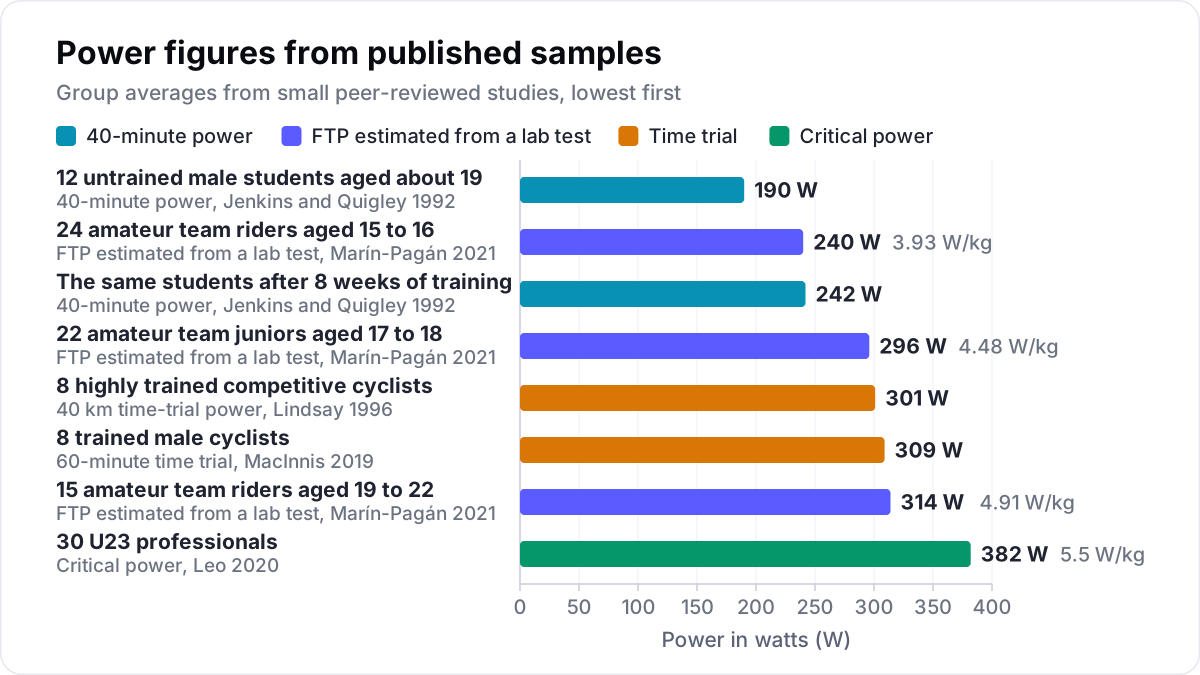
No study has measured a random sample of cyclists, so nobody can say how many watts an average cyclist produces. Small peer-reviewed samples give a ladder instead: about 190 W for 40 minutes in untrained young men, about 300 W for about an hour in trained male cyclists, and 382 W of critical power in U23 professionals.
Each figure below comes from a small group tested in a lab or a time trial, and each uses a slightly different measure.
| Who | Measure | Power | W/kg | Study |
|---|---|---|---|---|
| 12 untrained but active male students, about 19 years old | 40-minute power | 190 W | not given | Jenkins and Quigley, 1992 |
| The same students after 8 weeks of training | 40-minute power | 242 W | not given | Jenkins and Quigley, 1992 |
| 24 male amateur team riders aged 15 to 16 | FTP estimated from a lab test | 240 W | 3.93 | Marín-Pagán and colleagues, 2021 |
| 22 male amateur team juniors aged 17 to 18 | FTP estimated from a lab test | 296 W | 4.48 | Marín-Pagán and colleagues, 2021 |
| 8 highly trained competitive cyclists | 40 km time-trial power | 301 W | not given | Lindsay and colleagues, 1996 |
| 8 trained male cyclists | 60-minute time trial | 309 W | not given | MacInnis and colleagues, 2019 |
| 15 male amateur team riders aged 19 to 22 | FTP estimated from a lab test | 314 W | 4.91 | Marín-Pagán and colleagues, 2021 |
| 30 male U23 professionals | Critical power | 382 W | 5.5 | Leo and colleagues, 2020 |
For women at the top of the sport, a study of 44 professionals' training and racing files found an average best hour of 4.2 W/kg. The professional end is covered in our article on pro cyclist power output.
Charts of "average FTP by age" online usually come from an app's or a coaching service's own users: riders who own a power meter and chose to test. Such samples sit above the general cycling population, and some of those pages say so themselves. Treat their averages as a picture of keen riders, not of everyone who rides a bike.
How do age and sex change cycling power?
Power falls slowly with age, and women produce less on average than men. In 40 competitive men aged 25 to 63, time-trial power fell by about 24 W, or 7%, for each decade of age.
That study, by Balmer, Bird and Davison, timed 16.1 km indoor time trials. A 2024 study of more than 600 hour records, from a crowd-sourced database, found distance fell by 1.08% a year after the age of 40. In the same records, women's distances were 10.8% shorter than men's. Distance is not power, but the direction is the same.
Riders of different sizes compare fairly in W/kg on climbs, where they lift their own weight; on the flat, absolute watts matter more. The article on watts per kilo explains why. Training can change more than age does. The untrained students above gained 28% in eight weeks, as the study reports, four times what a decade of age took from the competitive men.
How many watts does a club ride or sportive need?
On a flat road in still air, a rider and bike of 80 kg on the hoods need about 120 W for 28 km/h and 143 W for 30 km/h when riding alone. Close on another rider's wheel, the same speeds take roughly a fifth less.
The table uses the standard road-cycling power model with sea-level air and good road tyres, the same assumptions as our guide to cycling aerodynamics.
| Speed | Alone on the hoods | Close on a wheel |
|---|---|---|
| 25 km/h | 90 W | 71 W |
| 28 km/h | 120 W | 94 W |
| 30 km/h | 143 W | 112 W |
| 32 km/h | 170 W | 132 W |
| 35 km/h | 216 W | 166 W |
The sheltered column assumes 27% less drag, the most Blocken and colleagues found for a rider directly behind another in an upright position, with the wheels almost touching. The saving falls as the gap grows. Deep in a large bunch the saving is far bigger. In a later study by Blocken's group of pelotons of 121 riders, riders well back in the bunch had only 5 to 10% of a lone rider's drag.
So a club ride at 30 km/h is not hard because of its average power. It is hard because of the turns on the front, the climbs and the surges, the same pattern as the example ride. A sportive adds hours: the question is what you can still hold on the last climb, which our guide to durability in cycling covers.
Why does your own trend beat any comparison?
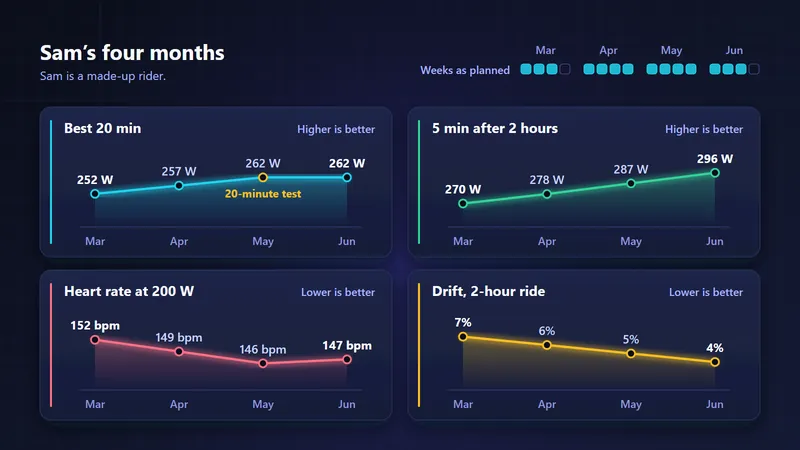
Your own numbers over months show whether your training works, while a comparison with other riders mixes different tests, power meters, weights and terrain. Compare the same efforts, on the same power meter, at the same time of year.
- Test FTP the same way each time. What FTP is explains the tests and their quirks.
- Watch your power curve. Your best 5 minutes, 20 minutes and hour this season against last tell you more than one ride. See the power curve explained.
- Use one loop or climb. Time and average power on the same climb, in similar weather, compare well.
- Keep one averaging setting. With zeros or without, keep it the same.
In Velograph, every ride with power shows its average power with freewheeling counted, its normalized watts and, once your weight is entered, W/kg. Dragging across a stretch shows its average power, normalized watts and W/kg. The free Rider plan keeps your rides with ride analysis and has no end date; see what a rider gets on their own.
Further reading
- Indoor 16.1-km time-trial performance in cyclists aged 25-63 years, Balmer, Bird and Davison, Journal of Sports Sciences, 2008.
- Performance profile among age categories in young cyclists, Marín-Pagán and colleagues, Biology, 2021.
- CFD simulations of the aerodynamic drag of two drafting cyclists, Blocken and colleagues, Computers and Fluids, 2013.
- Making history in 1 h: how sex, aging, technology, and elevation affect the cycling hour record, Harnish, Swinand and Fisher, Medicine and Science in Sports and Exercise, 2024.
Velograph is not affiliated with, sponsored by or endorsed by any team, rider or company named in this article. Names are used only to refer to publicly reported work.